Release 9.2.0
Part Number A96670-01
 Home |
 Book List |
 Contents |
 Index |
 Master Index |
 Feedback |
| Oracle Enterprise Manager Administrator's Guide Release 9.2.0 Part Number A96670-01 |
|
The Event system allows you to monitor your network for specific conditions, such as loss of service or lack of storage, that may occur in your managed environment. You select tests to run on managed targets (databases, nodes, listeners, or other services), then set the threshold parameters for which you want to be notified. You can share events with other administrators, in addition to being able to notify specific administrators when an event condition occurs. For some event tests, you can also choose to execute a fixit job that automatically corrects the problem.
The following topics are discussed in this chapter:
The Event system allows you to efficiently monitor large enterprise. Using the Event system and Intelligent Agents, you can effectively monitor any number of databases, nodes, or other services 24 hours a day, and be alerted when a problem or specific condition is detected. You can also pinpoint only the services you wish to monitor. The Event system can be extended to include other third-party applications that detect events independent of the Intelligent Agents.
In the Event system, event settings are stored based on the administrator registering the event. This allows administrators of large systems to customize their event systems to their preferences and tasks. Administrators receive messages for events for which they have been selected to receive notifications by other administrators.
The Event system includes the following processes:
You need to create and register events, which are simply a group of event tests that you want to run on your managed systems. Oracle Enterprise Manager includes a variety of predefined event tests that you can use when creating events. The event tests are grouped by target type, for instance:
You can create events using the predefined event tests that have been installed with Oracle Enterprise Manager. See "Event Categories and Types" on page 6-8 for more information.
The events are created with information entered in the Event property sheet. You determine parameters such as the target that is monitored, the specific tests to perform, the frequency that the event test is executed, and whether other administrators can share the events and which administrators should be notified if the event condition is met. See "Access" on page 1-23 for more information. Some event tests have parameters with threshold values that you can customize for your system. See "Event Parameters Page" on page 6-49 for more information. To use the Event system, an administrator must have sufficient privileges to access database objects from the Console. Under most circumstances, full DBA privileges are not required, nor would be appropriate to assign full DBA privileges to every administrator. For this reason, the OEM_MONITOR role was created.
Beginning with Oracle 8.0.6 databases and higher, the OEM_MONITOR role is created by the Oracle database creation scripts. This role permits access to database functionality within Enterprise Manager. For example, running events against a database (tablespace full, buffer cache hit ratio) or browsing through the objects in a database via the Console Navigator tree. These types of functionality require database credentials on which to perform these operations. Rather than granting the powerful DBA role to the database credentials, many administrators prefer to provide only the necessary privileges required to do these operations. Granting the OEM_MONITOR role to the database credentials, ensures that the user has the minimum sufficient privileges required for these operations.
If you need to create the OEM_MONITOR role manually, here are the steps you need to perform:
drop role OEM_MONITOR;
create role OEM_MONTOR:
grant connect to OEM_MONITOR;
grant analyze any to OEM_MONITOR;
grant create table to OEM_MONITOR;
grant select_catalog_role to OEM_MONITOR;
You are now ready to grant the OEM_MONITOR role to the database user that will be used as "database preferred credentials" in Enterprise Manager. In addition to granting the OEM_MONITOR role to a user, you must also ensure that the QUOTA for the user account is set to UNLIMITED.
The "Continued Row" event test needs to analyze results into a table so it needs both the "analyze any" and "create table" privileges.
Events are registered, or submitted, to specific targets, such as nodes, listeners, or databases. The status of a registered event is viewed in the Registered page of the Event pane. Note: The "Show Targets" checkbox is checked at the bottom of the Registered page.
The event scripts are executed on nodes with the permissions of the Intelligent Agent. However, some of the database event tests, such as Continued Rows, require access to system tables and require additional permissions. You need to set up preferred credentials for the monitored database with an administrator that has system privileges. See "Preferred Credentials" on page 1-25 for more information.
The Intelligent Agent is responsible for detecting when a specific event condition has occurred. The Intelligent Agent first notifies a Management Server, which in turn notifies interested administrators either through the Oracle Enterprise Manger Console, or by external means such as Email or Paging.
The Management Server is responsible for registering event information with the appropriate Intelligent Agents on nodes in the network. You determine the frequency that an Intelligent Agent checks an event. See "Event Schedule Page" on page 6-50 for details on setting the frequency interval for an event. An exception to this is the Up/Down (node) event test, which is checked at an interval set by the system itself. See "Fault Management Event Tests" on page 6-9 for more information on this event test.
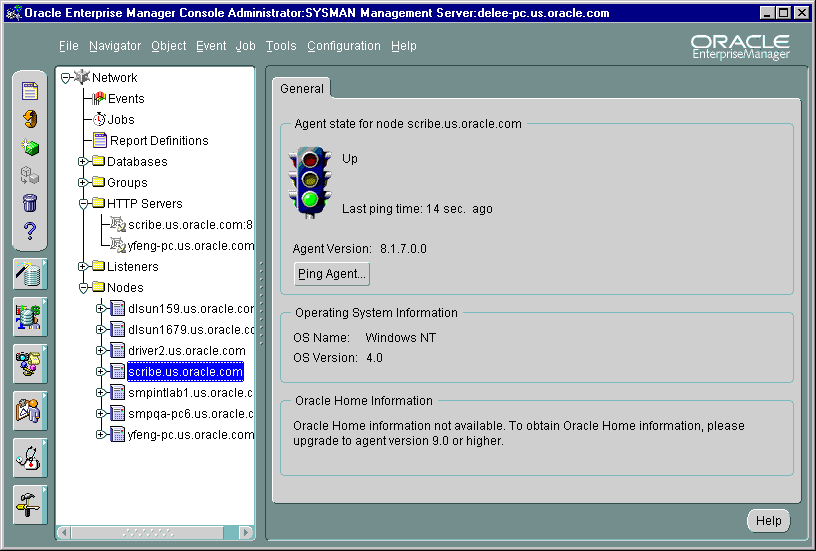
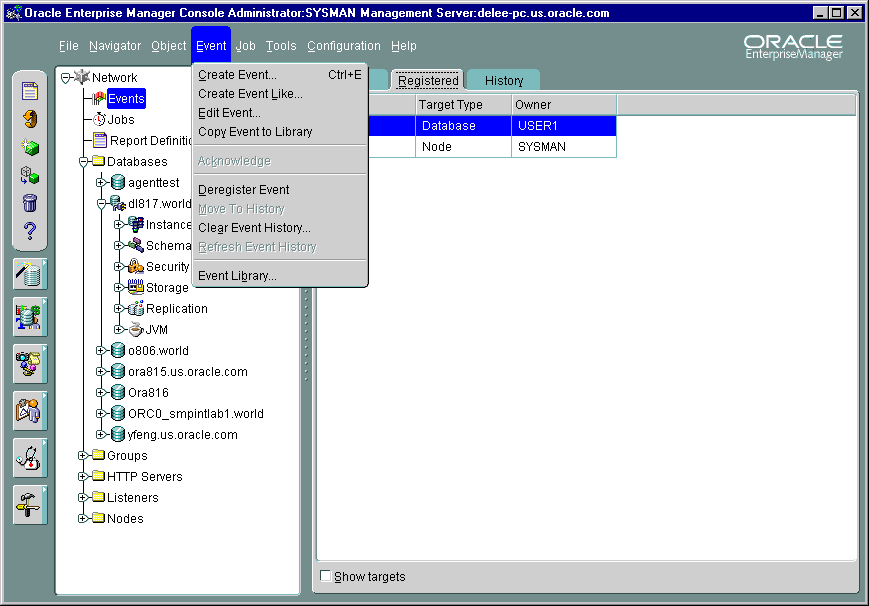
When an alert condition occurs, the Intelligent Agent is responsible for notifying the Management Server. Each event is logged in the repository and can be viewed and acknowledged in the Alerts page of the Console. See Figure 6-6, "Event Menu and Detail View" for an illustration of the Event pane.
Events can consist of multiple event tests. If any one of these tests identify a specified condition, the event is triggered and a notification is sent to the Console. If enhanced notification is configured for your system, paging and/or email notifications are sent.
Event notification occurs as follows:
Enterprise Manager administrators can be notified in various ways, such as electronic mail or paging, depending on the administrator's setup and permissions. You need to set up the notification services and determine the administrators that need to be notified for the events. See "Event Access Page" on page 6-51 and "Access" on page 1-23 to determine the administrators that receive notifications. See "Notification" on page 1-14 to determine how and when an administrator is notified.
If you plan to notify administrators with email or paging, you need to make sure the following is set up properly:
An event is composed of one or more event tests. While an individual event test may result in a different status (For example, some clear, some are in alert), there is a general status for the Event. To determine the general severity for the event, the following rules apply in succession:
You can still see the individual status of each event test in the Event Viewer.
All events return values and some events produce output messages. The events return different status icons depending on the severity of the event. These severity levels are determined by parameter thresholds you set for the event tests during event creation. The colors are displayed on the event severity icon that is located:
The colors of the event severity icons are:
An error state indicates there is a problem with the evaluation of the event condition, as opposed to a threshold being met. Examples of error states are: registering an Archive Full event against a database in non-archivelog mode, registering an event that monitors segments but specifying a filter that excludes all available segments.
A gray flag represents an "unknown" state where it is not possible for Enterprise Manager to ascertain the event status because the node is unreachable or the Intelligent Agent is not available. The gray flag will appear on the group pane and as the flag for the event in the Alert tab if your event includes at least one up/down event test (any target: node/database/listener). When the gray flag occurs, it will be set for the Event. When you see the event in the Event viewer, the flag for the up/down event test will be gray, and the flags for the other event tests will remain the color of their original state.
If you have an event that does not include any up/down event test, then even if the target node or Intelligent Agent become unavailable, the unknown state will not trigger for that event; the current severity for the event will be unchanged.
|
Note: Some events, such as Probe and User Blocks events, do not return a warning value because the warning threshold parameter is not used. The event has either occurred or not occurred. |
When an event occurs, you need to correct the problem. In some cases, you can create a fixit job that responds to specific event conditions. See "Event Fixit Jobs Page" on page 6-54 for more information. These situations are noted in the online help for Oracle events.
In other cases, the solution may require the attention of a system administrator. For example, space management event conditions may require an administrator to increase space requirements and resource management conditions may require an administrator to adjust initialization parameters. The online help for Oracle Event Tests has recommendations on how to resolve many of the common event condition.
If the Diagnostics Pack is installed, advice and/or related tools and charts are available to help administrators diagnose the problem. For additional information on Oracle database problems, refer to the Oracle Server Administrator's, Tuning, and Reference Guides. For network problems, refer to the Oracle networking guides for your system.
The Oracle event tests for the database, listener, and node destination types are grouped into categories:
Only the UpDown event tests are included with Oracle Enterprise Manager. These fall under the 'Fault' category for the selected target type. Additional advanced events for all categories are available with the optional Oracle Diagnostics Pack. Beginning with the Oracle Diagnostics Pack for Enterprise Manager version 2.2, operating system-specific tests are also available for NT and various UNIX platforms.
See the online help for Oracle predefined event tests, "Oracle Event Tests" on page 6-56, and the Diagnostic Pack documentation for information on events and their parameters. You can also refer to the Enterprise Manager Event Test Reference Manual for a comprehensive look at all available event tests. All the Node events are supported on Unix and Windows NT platforms. For other platforms, see your platform-specific documentation.
This category of event tests monitors for catastrophic conditions on the system, such as a database, node, or listener is down. Immediate action must be taken by the administrator. Examples of event tests available in this category include:
Most of the fault management event tests do not require any threshold values because the event test only checks whether the service is up or down or if the event condition occurred. For the Alert event test, the event test checks whether error messages are written into the database alert log file.
The UpDown event tests are provided with the Enterprise Manager base product. These event tests check whether a database, listener, or node is available. With the UpDown event test for databases or listeners, you can use the Startup Database or Startup Listener task as a fixit job to re-start the database or listener. To avoid executing that job when the database or listener is brought down intentionally, you need to remove the event registration or blackout the target.
This category of event tests track possible space problems, such as running out of space on a disk or archive device. Examples of space management event tests in this category include:
To check for space management events, set a threshold on the free space left. For example, set an alert if the free space on a disk falls below a specific number of bytes. In order to properly choose the threshold value, you need to know the characteristics of the tablespaces. For example, you would want to know whether the tablespaces contain online transaction processing (OLTP) tables or decision support tables. The former usually has a very fast growth rate, while the latter almost never grows.
This category of event tests track possible resource problems, such as exceeding datafile or lock limits. Examples of resource management event tests in this category include:
To check for resource management events, set a threshold on the percentage of a resource used. For example, you can set an alert if the percentage of the datafile resource used is greater than a specified value.
This category of event test monitors the system for performance problems, such as excessive disk input/output or library cache miss rate. Examples of events in this category include:
To check for performance management events, set a threshold on a system value. For example, you can set an alert if the library cache miss rate is greater than a specific value. The set of threshold values is system specific, depending on the hardware platform, number of users, and other factors.
Unsolicited event tests are events that have been initiated outside the Enterprise Manager Event system. An event is considered unsolicited if it is raised by a process other than the Oracle Intelligent Agent, but is running on the same node as the Intelligent Agent. These events are usually checked and provided by third-party software. Creating an unsolicited event allows you to integrate and monitor third-party events. Essentially, there are two phases to setting up an unsolicited event:
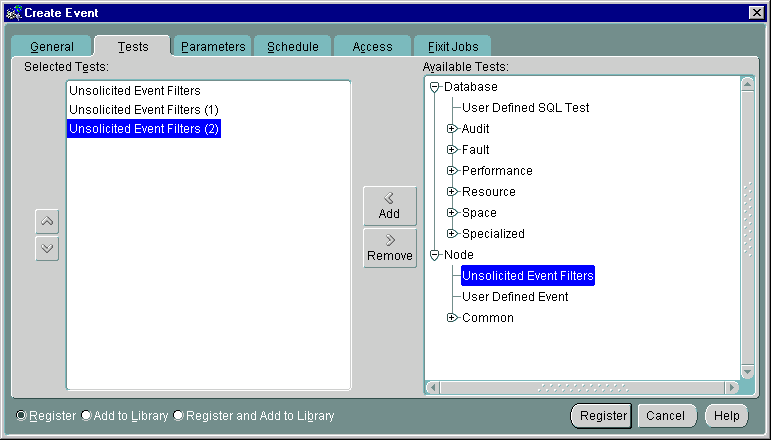
In order to receive unsolicited events, you must create and register an event that is expecting to receive unsolicited events. The event should have the event test "Unsolicited Event Filters." This event test also allows you to filter on only those unsolicited events you are interested in.
To register interest in an unsolicited event, choose the Unsolicited Event Filters event test in the Test page and complete the Parameters pages.
Text description of the illustration unsolevt.gif
You can have more than one unsolicited event test per event. Information on how to fill out the Parameters page is discussed in the next section. After completing the unsolicited event, you can save and submit the event. See "Event General Page" on page 6-46 for more information.
Because unsolicited events originate outside the Event system, you may wish to screen only for specific external events. The Parameters page for the Unsolicited Event Test allows you to filter unsolicited events based upon the event name.
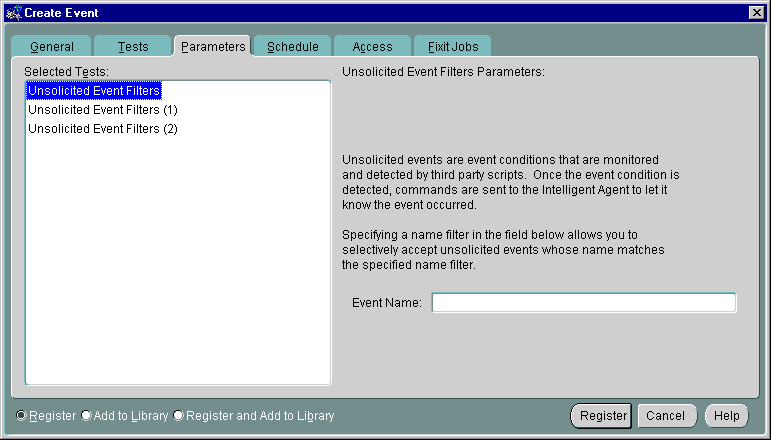
Text description of the illustration unsolevp.gif
This is the four-part name of the event of the form:
/vendor/product/category/name
You can enter any character string but all four parts and the forward slashes (/) are required. The eventname is assumed to be in 7-bit ASCII, so that it never changes regardless of platform or language. The name of the event that fires must match the value specified in this parameter field in order for the unsolicited event to fire.
You can enter a wildcard "*" to specify no filtering. In this case, all unsolicited events that are raised by third-party applications will trigger this unsolicited event.
When third-party applications detect their own external events, they can notify the Intelligent Agent by raising the event. To raise unsolicited events, users have a choice of a command-line interface (oemevent executable) or an OraTcl verb (orareportevent). The related syntax is as follows:
oemevent [event_name] [object_name] [severity] [message]
orareportevent [event_name] [object_name] [severity] [message]
where event_name is the name of the event that triggered the unsolicited event. object_name (valid discovered target name) is the name of the object that the event is monitoring, severity is the level of severity for the event, and message is the text string to be displayed in the Enterprise Manager Console. For additional details, please refer to the Intelligent Agent User's Guide.
Note that the severity is specified as a character string in oemevent and as an integer in orareportevent. Also, note that the event_name must be a four-part string of the form /a/b/c/d, where the different elements may be used to organize the event test within a hierarchy of event tests. For example, /myevents/node/files/filefound may be an event test you developed. It relates to nodes, more specifically space on nodes, and it monitors for the existence of a particular file.
For information on OraTcl and event scripts, see the Oracle Intelligent Agent User's Guide.
Typically, unsolicited events are evaluated and raised by third-party software. Enterprise Manager allows you to implement monitoring of unsolicted events through the Job system and Tcl. You create a Tcl job and submit it as a periodic job. The Tcl contains logic to evaluate the underlying test and decide whether it needs to raise the event and at what severity level. Since the job is submitted as a periodic job, the underlying test is evaluated periodically like all regular Enterprise Manager event tests. Techniques such as those in the following examples, allow users of Enterprise Manager to implement and customize event monitoring specific to their environments.
It is possible to submit a job with an imbedded OS command task that executes the oemevent program and passes the program all necessary arguments. All users that have registered for the unsolicited event raised by oemevent will receive the event notification. The event has to be known to the administrator submitting the job that raises it.
The job that raises the event may contain enough logic to evaluate the underlying test and decide whether it needs to raise the event and at what severity level. Such a job may be submitted as a periodic job so that the underlying test is evaluated periodically, which is similar to regular Enterprise Manager event tests.
Unsolicited events are evaluated in their own process and within the proper OS security protocols and do not pose security or robustness threats to the system. Introduced here is a procedure where the user must submit a job in order to monitor for an external event.
The following example illustrates how to implement an event test that triggers when a particular file is found. Let's call this event /myevents/node/files/filefound.
The following Tcl script needs to be submitted as the job:
# event name
set event_name /myevents/node/files/filefound
# filename to look for comes at the first (and only) argument
set file_name [lindex $argv 0]
# check for the file, and if it's found trigger the event as critical
if { [file exists $file_name] }  {
   orareportevent $event_name $oramsg(oraobject) 2 "$file_name found"
}
In order to receive this event, a user needs to register an event with the Unsolicited Event Filters test selected and configured to filter an event name of the format:
/myevents/node/files/filefound.
This event should be registered against a node and will trigger against it. The message associated with the event occurrence will contain the values of all parameters passed into orareportevent.
Although this event is fairly straightforward, there are two problems:
Any other scripting language or executable program can also be used to implement the logic of an unsolicited event test. However, Tcl is preferred because it allows platform-independent implementation and the fact that the code may be sent from the Enterprise Manager Console `on-demand' without requiring anything to be installed on the Intelligent Agent side.
As with regular Enterprise Manager events, unsolicited events could be triggered only once per condition detected and could clear automatically if the condition that triggers the event is no longer met. Events adhering to this operational pattern are said to have a "proper lifecycle."
Typically, scripts that implement unsolicited events are composed of two basic parts:
The following Tcl script illustrates this two-part script implementation, as well as a technique that allows proper event lifecycle.
#---------------------------------------------------------------------
#
# Tcl Procedure
#        orareportevent1
#
# Purpose:
#        Trigger an unsolicited event only previous state is different
#
# Arguments:
#        - event_name: event test to trigger
#        - severity: new severity
#        - message: message to be attached to the event report
#
#---------------------------------------------------------------------
proc orareportevent1 {event_name severity message} {
   # define a 'lock' that its contents define the previous event status
   # and figure out the event state during the previous execution
   global oramsg
   append event_lock [tempdir] "/" $oramsg(jobid) ".el"
   if { [file exists $event_lock] } {
      set f [open $event_lock r]
      gets $f previous_severity
      close $f
   } else {
      set previous_severity -1
   }
   # if event test state has changed, trigger the event at new severity
   if { $previous_severity != $severity }  {
      orareportevent $event_name $oramsg(oraobject) $severity $message
      if { $severity == -1 } {
         rmfile $event_lock
      } else {
       set f [open $event_lock w]
       puts $f $severity
       close $f
      }
   }
}

#---------------------------------------------------------------------
#
# Event Test Name:
#        /myevents/node/files/filefound
#
# Purpose:
#        Monitor for the existence of a particular file
#        The test triggers at warning level if the file exists, but
#        at critical level if the file is larger than the specified
#        value
#
# Arguments:
#        - filename to look for
#        - critical file size
#
#---------------------------------------------------------------------
set event_name /myevents/node/files/filefound
set file_name [lindex $argv 0]
set critical_filesize [lindex $argv 1]

if { [file exists $file_name] } {
   # if the file exists calculate its size in Kilobytes
   set file_size [expr [file size $file_name] / 1024]
   if { $file_size > $critical_filesize } {
      # if file is larger than the critical value, trigger as critical
      orareportevent1 $event_name 2 "Size: $file_size Kb"
   } else {
      # if file is smaller than the critical value, trigger as warning
      orareportevent1 $event_name 1 "Filesize: $file_size Kb"
   }
} else {
   # if file in no longer there, clear the event
   orareportevent1 $event_name -1 "File does not exist"
}
This example of an unsolicited event test illustrates a situation where the test evaluation involves connecting to an Oracle instance and executing some SQL against it.
This example checks the size of a particular table in the database and triggers the event when a set threshold is crossed. There is a warning value and a critical value. The size of the table is measured by counting the number of its rows.
#---------------------------------------------------------------------
#
# Tcl Procedure
#        orareportevent1
#
# Purpose:
#        Trigger an unsolicited event only previous state is different
#
# Arguments:
#        - event_name: event test to trigger
#        - severity: new severity
#        - message: message to be attached to the event report
#
#---------------------------------------------------------------------
proc orareportevent1 {event_name severity message} {
   # define a 'lock' that its contents define the previous event status
   # and figure out the event state during the previous execution
   global oramsg
   append event_lock [tempdir] "/" $oramsg(jobid) ".el"
   if { [file exists $event_lock] } {
      set f [open $event_lock r]
      gets $f previous_severity
      close $f
   } else {
      set previous_severity -1
   }
   # if event test state has changed, trigger the event at the new severity
   if { $previous_severity != $severity }  {
      orareportevent $event_name $oramsg(oraobject) $severity $message
      if { $severity == -1 } {
         rmfile $event_lock
      } else {
       set f [open $event_lock w]
       puts $f $severity
       close $f
      }
   }
}

#---------------------------------------------------------------------
#
# Event Test Name:
#        /myevents/database/space/tablesize
#
# Purpose:
#        Monitor the size of a particular database table
#        The test triggers at warning level when the warning threshold
#        is crossed and at critical level when the critical threshold
#        is crossed
#
# Arguments:
#        - table name
#        - critical threshold
#        - warning threshold
#        - username/password for conneting to target (optional)
#
#---------------------------------------------------------------------
set event_name /myevents/database/space/tablesize
set table_name [lindex $argv 0]
set critical_threshold [lindex $argv 1]
set warning_threshold [lindex $argv 2]

if { $argc == 4 } {
   set connect [format "%s@%s" [lindex $argv 3] $oramsg(oraobject)]
} else {
   set connect [format "%s/%s@%s" $SMP_USER $SMP_PASSWORD $oramsg(oraobject)]
}

if {[catch {oralogon $connect} lda]} {
   append msg "Cannot connect to target." "\n" $oramsg(errortxt)
   orafail $msg
}

if {[catch {oraopen $lda} cur]} {
   append msg "Cannot connect to target." "\n" $oramsg(errortxt)
   oralogoff $lda
   orafail $msg
}

set sql [format "select count(*) from %s" $table_name]
if {[catch {orasql $cur $sql}]} {
   append msg "Cannot execute SQL against the target." "\n" $oramsg(errortxt)
   oraclose $cur
   oralogoff $lda
   orafail $msg
}

if {[catch {orafetch $cur} row]} {
   append msg "Cannot execute SQL against the target." "\n" $oramsg(errortxt)
   oraclose $cur
   oralogoff $lda
   orafail $msg
}

set current_tablesize [lindex $row 0]

if { $current_tablesize > $critical_threshold } {
   orareportevent1 $event_name 2 "Table:$table_name #rows:$current_tablesize"
} elseif { $current_tablesize > $warning_threshold } {
   orareportevent1 $event_name 1 "Table:$table_name #rows:$current_tablesize"
} else {
   orareportevent1 $event_name -1 "Table:$table_name #rows:$current_tablesize"
}
A number of OraTcl verbs were used in this script. Refer to the Intelligent Agent User's Guide for details on OraTcl verbs. Note that the preferred credentials, specified in the Console, are available to the script writer via the SMP_USER and SMP_PASSWORD Tcl global variables. For jobs against a database, the values of those variables are set to the username and password specified as preferred credentials for that database. This script also allows for an optional overwrite of the preferred credentials via an optional forth input argument.
The Event system provides you with two types of user-defined monitoring capability:
The User-Defined SQL Event test is used for database-specific events. It allows you to define your own custom database events by specifying your own SQL query that will evaluate the event condition. The return value of the SQL query will be compared against thresholds you specify.
The User-Defined Event test can be used to monitor any type of event condition. It allows you to specify your own monitoring scripts that will be used to monitor the event condition. These scripts can be written in any scripting language suited to your environment.
The User-Defined SQL event test allows you to define your own SQL script that evaluates an event test. The event tests you define should be written as queries, such as SELECT statements, that return condition values for which you are monitoring. These values are checked against the Critical threshold and Warning threshold limits you specify, and trigger the event if the threshold limits are reached.
You have a custom application that runs against the Oracle database. Each time it finds an application error, it creates an entry into a table called "error_log". Using the "User-Defined SQL Test", you can write an event test that notifies you when it finds at least 50 errors. Specifically, you define the following SQL statement:
select count(*) from error_log
This returns the number of rows in the error_log table. Since you want a critical alert raised when it reaches at least 50, you specify the Operator " >= ", a Critical Threshold value of 50, and a Warning Threshold value of 30.
If your query for the event condition requires more complex processing than is allowed in a single SELECT statement, you can first create a pl/sql function that contains the extra processing steps, and then use the pl/sql function with the User-Defined SQL event test. Your pl/sql function must still return a value that can be compared against the Critical and Warning thresholds.
You need to trigger a critical alert whenever an employee's salary is $500 higher than the highest manager's salary. You first define a pl/sql function as follows:
create or replace function overpaid_emp return number is
max_mgr_sal number;
max_emp_sal number;
begin
select max(sal) into max_mgr_sal from scott.emp where job = 'MANAGER' or job =
'PRESIDENT';
select max(sal) into max_emp_sal from scott.emp where job != 'MANAGER' and job
!= 'PRESIDENT';
return (max_emp_sal - max_mgr_sal);
end;
This pl/sql function returns the difference between the highest employee's salary and the highest manager's salary. If the difference is a positive number, then an employee has the higher pay. If the difference is more than 500, then a critical alert needs to be triggered.
When defining this event this using the User-Defined SQL event test, you define the SQL statement as follows:
select overpaid_emp from dual
Then use the Operator ">" and Warning threshold of 100 and Critical threshold of 500.
Note that ROLES are not enabled within PL/SQL functions, so any privileges that are granted via ROLES will not work from within the function. You may need to grant the privileges directly to the database user account that is used for the event. (The database user account used for the event is either the Preferred Credentials user for the database, or the overwritten preferred credentials).
The User-Defined event test (available with the Oracle Diagnostics Pack) allows you to define your own scripts that monitor conditions particular to your environment. These event tests can be written in any scripting language, as long as the node that runs the script has the appropriate runtime requirements to execute the script.
The power and flexibility of User-Defined event tests lie in the ability to integrate any, custom script into the Enterprise Manager Event System and leverage the system's multi-administrator, lights-out scheduling and notification capabilities.
User-Defined events are implemented in two phases:
Using a scripting language of your choice, create a script that contains logic to check for the condition being monitored. Examples of these are scripts that check for disk or memory usage. All monitoring scripts should contain these basic elements:
Define logic in the code that checks the condition being monitored. For example, the amount of free space on a particular filesystem, memory usage, etc.
After checking the monitored condition, the script should return either the value associated with the monitored object OR the event status severity.
If you choose to have the script return the value of the monitored object (e.g. actual disk usage), then it means you want the Enterprise Manager Event system to evaluate the object's current value against Warning and Critical thresholds you specify. You specify these warning and critical thresholds when you register the event.
Otherwise, if you choose to have the script itself evaluate the event status severity of the monitored object, you need perform this evaluation in such as way that it falls under one of following event status severities:
After evaluating the status of the monitored object, the script needs to return this result back to the Event System. The script should return the result by sending tagged information to standard output (stdout) using the syntax that is consistent with the scripting language. The result information to be sent should be enclosed by a pair of well-known tags. The following are the tags that are recognized by the Event System as it checks the information in stdout:
Enclose within these tags the current value of the monitored object OR the event status severity.
Example:
print "<oraresult>200</oraresult>"
Returns 200 as the value of the monitored object
print "<oraresult>2</oraresult>"
Returns an event status of 2 (event in critical state)
Enclose in these tags the message to be sent with the event notification if the event triggers.
Example:
print "<oramessage>Disk usage is high</oramessage>"
Enclose in these tags the message to be sent if a failure occurs in the script. The occurrence of an <orafailure> in the standard output is equivalent to sending a tagged <oramessage> and an <oraresult> set to -2 (script failure).
Finally, the script itself will need to be entered in the Create Event property sheet when creating the event or be located in the monitored node. The node needs to be monitored by a 9i or higher Intelligent Agent. Make sure the node has the script's runtime requirements (e.g. perl interpreter ) and that the script works independently of the event system.
Special conditions
oraresult in stdout. A missing oraresult results in script failure. Having more than one oraresult in the output also results in script failure.Current result: <value in oraresult>
When the user-defined event is evaluated, it executes the script using the Node credentials associated with the event. These are either the default Node credentials associated with the Enterprise Manager administrator who registered the event or the overwritten Node credentials specified when the event was registered, as explained in the next section. Note that any environment associated with these Node credentials will not be available when the script is run.
Once you have created the monitoring script, you are ready to add the script's monitoring functionality to the Enterprise Manager Event system. To create and register a user-defined event for your monitoring script:
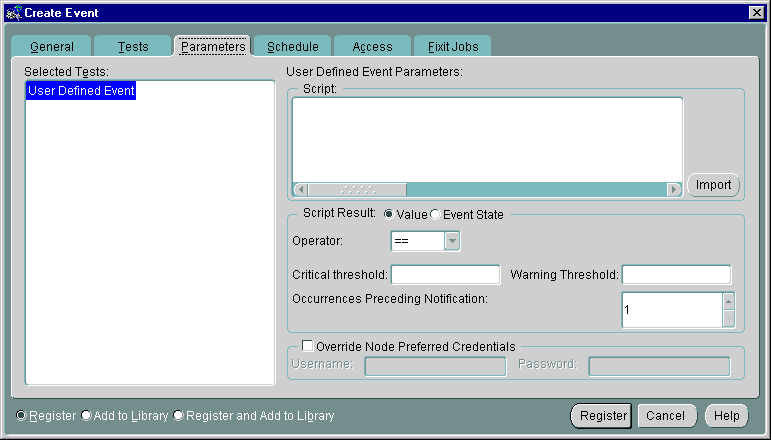
The User-Defined Event parameters page allows you to allows you to specify the user-defined event test information required to successfully register the event in the Enterprise Manager Console.
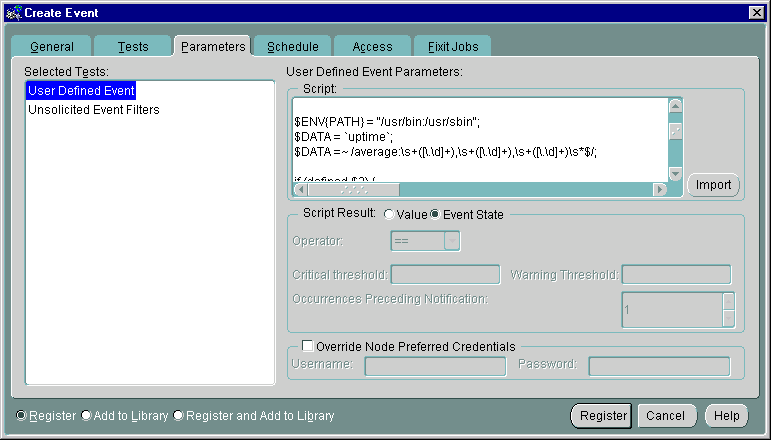
Text description of the illustration ude_scri.gif
User-Defined event test parameters consist of the following:
Enter the monitoring script used for the event evaluation. You can specify this either by entering the full text of the script OR by entering the fully-qualified script name (on the monitored target).
If you choose the enter the full text of the script, and if the script is in a file locally accessible to the console, you can use the "Import" button to load the script from the file instead of manually entering the script.
If your script file resides on the monitored target, you can just specify the fully-qualified filename of the script instead of loading the script text.
This parameter indicates the way the results of the event evaluations are returned by your script. You can specify one of two ways in which results are returned: by Value or Event State.
Your script evaluates the condition and returns the value of the monitored metric. Enterprise Manager will then compare the value against specified thresholds.
The following parameters indicate how you want Enterprise Manager to evaluate the value of the monitored metric.
Operator: The operator that Enterprise Manager should use when comparing the value of the monitored metric against the specified thresholds. Select one of the following comparison operators:
Critical Threshold: The value against which the monitored metric is compared using the specified operator. If it holds true, the event triggers at a Critical level.
Warning Threshold: The value against which the monitored metric is compared using the specified operator. If it holds true, the event triggers at an Warning level.
Occurrences Preceding Notifications: The number of times the event condition should hold true before a notification is sent.
You may want to create an event that monitors disk space. You can write a script that checks the amount of free disk space and returns that amount as the value to be evaluated. You may want the event to trigger at Warning level when the free disk space is below 500K, and to trigger at Critical level when the free disk space is below 200K. Hence, when defining the event, you would specify the following:
Script: Enter the script text or click Import to load an existing file. If the name of your script is "checkspace.sh" and if it is located on the monitored node, you can, for example, simply enter: /u1/private/checkspace.sh.
Event Parameters Page Settings
If you choose this option, the script you write evaluates the event condition and also determines if the event has triggered at a Critical or Warning level, or has not triggered at all (e.g. the event status is Clear or the script has failed to run due to some error). In order to provide the appropriate event status to Enterprise Manager, the script should define and return the appropriate event status. For more information, see "Creating Your Monitoring Script" on page 6-22.
Override Node Preferred Credentials: When your script is executed, it runs as the operating system user specified by the Node credentials associated with the event. These credentials are either the default Node credentials of the Enterprise Manager administrator who is registering this event, or the credentials specified here. It is important to note, however, that any environment associated with the Node credentials will not be used when the script is run.
If the event triggers, the value of the monitored metric is returned. The actual message to be displayed depends on the message you defined in your script via the <oramessage> tags. If no message is specified, the default message is: Current result: <value of monitored metric>. If a failure occurs, then the message displayed is the message specified in the <orafailure> tag.
Enterprise Manager has bundled a sample user-defined event script that monitors the 5-minute load average on the system. The script performs this function by using the 'uptime' command to obtain the average number of jobs in the run queue over the last 5 minutes.
The script is written in Perl and assumes you have Perl interpreter located in /usr/local/bin on the monitored node.
This script, called udeload.pl, is installed in the $ORACLE_HOME/sysman/admin directory where $ORACLE_HOME is the Oracle directory where the Enterprise Manager is installed.
Full text of the script:
#!/usr/local/bin/perl

# Description: 5-min load average.
# Sample User Defined Event monitoring script.

$ENV{PATH} = "/usr/bin:/usr/sbin";

$DATA = `uptime`;
$DATA =~ /average:\s+([\.\d]+),\s+([\.\d]+),\s+([\.\d]+)\s*$/;


if (defined $3) {
   print "<oraresult>$2</oraresult>\n";
} else {
   print "<orafailure>Error collecting data</orafailure>\n";
}
Setting Up the Sample Script as a User-Defined Event
<oraresult>2.1</oraresult>
Script: /private/myhome/udeload.pl (.... or the fully qualified path to where the script is)
Script Result: make sure the "Value" option is selected
Operator: >=
Critical threshold: 0.005
Warning threshold: 0.001
Occurrences Preceding Notification: 1
Override Node Credentials: Specify the credentials of an OS user that can execute the script.
In this example, we want the event to trigger at a Warning level if the 5-minute load average on the machine reaches 0.005, and trigger at a Critical level if the 5-minute load average reaches 0.001. Feel free to change these thresholds depending on your system.
When the 5-minute load reaches at least 0.001, you should see the event trigger in the Enterprise Manager Console as well as have the selected administrators be notified of this event.
Events include the target type and the event information that you want to monitor. Events can consist of multiple event tests. To create and register an event:
If you registered an event, the Intelligent Agent on the target node processes the event and the event appears in the Registered page of the Event pane. If the "show Targets" checkbox is selected, each destination target is listed separately with the event. If the "Show Targets" box is not checked, only the target name, type, and owner is shown.
|
Note: There is usually a slight delay between the time the event is registered and the actual notification by the Intelligent Agent. |
When threshold values are exceeded for the tests in an event, the event appears in the Alerts page of the Event pane. The notification changes the color of the severity flag for the event in the Alerts page. If a destination icon is displayed in the Group pane, the flag on the icon changes color. The colors and their meaning are:
Cases where an event notification is Unknown (gray flag) indicate the Intelligent Agent or node where the event is registered is unavailable or inaccessible, or the Intelligent Agent on that node is unavailable.
Do not register an UpDown event (included in the Oracle DB Fault event) against the database or node where the Repository schema is stored. If the database containing the Repository goes down, the Management Server also shuts down. Hence, the Intelligent Agent cannot inform the Management Server that the database is down.
The property sheet for creating a new event is the same as the property sheet for modifying an event, except that the event name and target type fields are always read-only. See Figure 6-8, "Event General Page" for an illustration of the Event property sheet.
See "Event Categories and Types" on page 6-8 for more information.
Dynamic event modification allows you to actively modify a registered event and have the changes automatically applied to all monitored targets of that event. For example, you can add an additional database to be monitored if you have an existing Tablespace Full event. The Intelligent Agent for the newly added database will now monitor for tablespace full conditions.
However, not all event attributes can be changed. What you are allowed to change depends on the version of the Intelligent Agent used with each monitored target. You may have older versions of the Intelligent Agent running on different targets within your enterprise and these older versions of the Intelligent Agent will only support a subset of modifications you can make using a 9i Agent.
Because pre-9i Intelligent Agents do not support dynamic event modification, if an event contains targets running pre-9i Intelligent Agents, modification will be limited. If all targets running pre-9i Agents are removed from the Monitored Targets list, then full modification of the registered event will be enabled.
Text description of the illustration eventgen.gif
The following are general usage guidelines for dynamic modification of events:
Text description of the illustration node_ps.gif
When dynamically modifying events, there are general system behaviors of which you should be aware:
For example, if your event originally had a mix of targets running pre-9i and 9i Intelligent Agents, then the Tests, Parameters, Schedule, and Fixit Jobs property pages will be disabled for editing. If during the edit session, you remove the targets running the pre-9i Intelligent Agents, then the Tests, Parameters, Schedule, and Fixit Jobs property pages will now allow editing since the remaining targets support editing of those attributes. However, if any of those attributes are changed in this edit session, you will not be able to bring back the original pre-9i targets you removed. (To bring back the original pre-9i targets, you first have to submit the changes, then re-edit the event to add back the pre-9i targets).
The Event detail view, which displays when you select the Events object in the Console Navigator, contains the following pages:
You can switch between the pages by clicking the tab of each page. The rows in any page can be sorted on any column by clicking the column heading. See Figure 6-6, "Event Menu and Detail View" for an illustration of the Event detail view.
Text description of the illustration event2.gif
Because the detail view changes in relation to the object selected in the Console Navigator, Enterprise Manager allows you to "undock" the Event detail view from the Console so that it can be persistently displayed. This allows you to keep an eye on the status of monitored events while you perform other tasks from the Console.
To launch the Event detail view in a floating window, select the Events object from the Navigator and choose 'Display in New Window' from the context-sensitive menu.
The Alerts page displays event tests that have been triggered.
Severity of the event occurrence: critical (red flag), warning (yellow flag), clear (green flag), unknown (gray flag), or error state (yellow hexagon).
Name of the event.
Target where the event was triggered.
Database, listener, node, or HTTP Server.
Time and date of the event occurrence.
Administrators assigned to work on the event occurrence.
Administrator who owns the event.
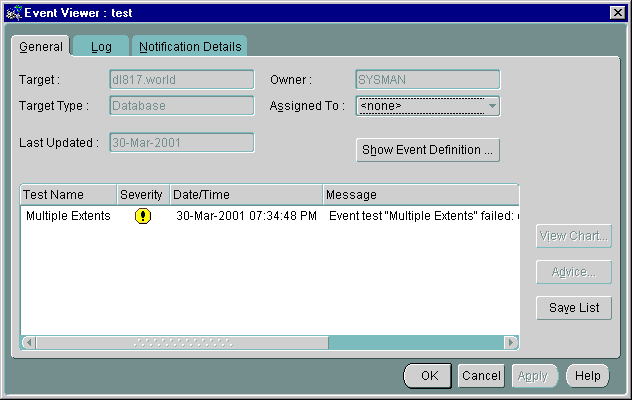
To view details of an event that has occurred, double-click on the event in the Alerts or History page to display the Event Viewer property sheet. See "Event Viewer" on page 6-42 for more information. You can enter notes on the nature and progress of the event condition.
|
Note: Comments entered into the log are viewable/editable by admins with the Modify permission. After you have reviewed an event, you can move it to the History page. See "Event Viewer" on page 6-42 for more information. |
The Event History page displays a history of events that have occurred and have been moved to History by an administrator or cleared by an Intelligent Agent. The Event History page displays the same columns as the Alerts page.
The History page is refreshed automatically each time you move between the History page and the Alerts or Registered page. However, to refresh the event history list while currently viewing the History pane, you must click the Refresh icon located in the Console toolbar.
To clear all entries in the History page, choose Clear Event History from the Console's Event menu. You can delete entries individually by right-clicking on a specific event in the History page and choosing Delete Item(s) from the context-sensitive menu.
The Registered page displays the events that have been registered, or submitted, to monitor test conditions on network objects. The Registered page contains the following information:
Name of the event.
Target where the event is monitored. Displayed only when Show Targets is checked.
Type of event destination: database, node, listener, web server, Concurrent Manager,
Current registration status of the event: Registered, Registration Pending, De-Registration Pending, Modification Pending, and Registration Failed. Displayed only when Show Targets is checked. The registered event status is only updated when this page is refreshed.
Administrator who owns the event. Displayed only when Show Targets is checked.
When checked, the Registered page displays Target and Status information. By default, "Show Targets" is not checked.
Under certain circumstances, an event will remain in a Registration Pending state.
The Event menu allows you to set up event and administrator information. This menu also provides options to register, track, and view specific events. Menu options are enabled or displayed according to the items selected in the Event pane. See Figure 6-6, "Event Menu and Detail View" for an illustration of the Event menu.
When you register or remove an event, there is usually a slight delay while the Intelligent Agent processes the request.
Displays the Event property sheet and allows you to create the definition of a new event. See "Event General Page" on page 6-46 for more information.
Available when an existing event is selected in the Console's Event detail view, this option displays the Event property sheet with the same page and parameter settings as the selected event. You can then save the event as under another event name.
Displays the definition of the selected event and allows you to edit the event. This menu option appears when an event is selected in the Registered page.
Displays the definition of an existing event. See "Event General Page" on page 6-46 for more information.
Acknowledges the selected event in the Alerts page. When an event triggers, an entry is added to the Alerts page. In the severity column, a flag of the appropriate color is displayed along with a pair of eyeglasses. The eyeglasses also appear whenever there is a change in the status of the event (e.g. from `warning' to `critical') If you choose to "acknowledge" this event, then it means you are aware of this event occurrence and hence the eyeglasses will disappear. This is useful in multi-administrator environments where the presence or absence of eye glasses indicates whether or not someone has looked at the event.
Copy the selected event in the Event pane to the Event Library.
Deregisters the event. This menu option only appears when an event test is selected in the Registered page.
Moves the selected event in the Alerts page to Event History page of the Event pane. This option is enabled when an item is selected in the Alerts page.
Updates the History pane with the most recent entries.
Clears the contents of the Event History page.
Displays the Event Library dialog. See "Event Library Dialog" on page 6-41 for more information.
If you select an item in the Event pane with the right mouse button, the context-sensitive menu for that item appears. This menu is a subset of the Event menu plus selection-specific menu options.
The Event Library dialog displays the events that have been created and saved to the Event Library. The advantage to using the Event Library is that both events and any associated target information can be stored, copied, or modified in the library for future use. When you create an event, you have the option of submitting, saving to the Event Library, or submitting and saving to the Event Library.
This dialog contains the following information:
Name of the event.
Administrator who created the event.
Select an event and click Edit to display the property sheet for the library event. The property sheet allows you to view and modify the library event. In addition to editing, you can perform a wide variety of event-related operations such as deleting, registering, and creating new events based on an existing event in the Event Library. If an event of the same name is already actively running, you must first remove the active event from all targets before registering it again.
Updates the library events with the current definition at any time.
Several predefined event tests have been installed with Oracle Enterprise Manager. These appear in the Tests page of the Event property sheet, depending on the target type selected on the General page. You can add these tests to an event. The tests include:
Only the UpDown tests are included with Oracle Enterprise Manager. Additional advanced event tests are available with the optional Oracle Diagnostics Pack. Refer to the Enterprise Manager Event Test Reference Manual for a complete list of advanced event tests.
To view the specific tests assigned to an event, double-click on the event in the Event Library dialog and view the Test page of the Event property sheet. See the online help for Oracle events, "Oracle Event Tests" on page 6-56, or the Diagnostic Pack documentation for information on Oracle event tests and their parameters.
The Event Viewer property sheet displays details on a selected event in the History or Alerts page. When an event triggers, you select the triggered event and bring it up in the Event Viewer. The Event Viewer contains information on why the event triggered. You can also assign the event to a particular administrator and put instructions for other administrators via the Log page.
You can enter optional comments in the Log page, which is good way to share information about an event with other administrators. Once cleared, events are automatically moved to the History page. The pages of the Event Viewer include:
The Event Viewer General page displays statistics and author information on a selected event. To obtain information on how to respond to an event occurrence, refer to the "User Action" section of the individual event test:
The following statistics are displayed:
Destination of the event.
Database, listener, node, or HTTP server.
Time of last update
Administrator that created the event.
List of administrators to which the event can be assigned. These administrators have at least "view" access to the event.
Displays the Edit Event property sheet in view mode.
Event test that is performed.
Severity of the event occurrence: critical, warning, clear, or unknown.
Time and date of the event occurrence.
Message generated from the alert.
The Event Viewer Log page displays an entry whenever an event is moved to history. An event can be moved manually with the Move to History menu option or automatically when the severity of the event changes.
The Log page also allows comments to be entered on a selected event. Any administrator with permissions to modify the event can add comments in this page. Administrators can enter tips on how to resolve the problem which might be useful for other administrators. You enter comments in the text box and select the Apply or OK button to add the comment.
The information displayed in the Log page includes:
Text input field allowing you to add comments.
Comment that has been entered for this event.
Administrator that entered the comment.
The date and time when the comment was entered.
The Event Viewer Notification Details displays details of email and paging notifications sent for a selected event. The information displayed in Details page includes:
The severity flag associated with the event occurrence.
Administrator that was notified.
The date and time of the notification.
Method of notification: E-mail or page.
Status of the notification, indicating whether the notification was sent, is pending, or has failed.
If the notification failed, this message indicates the reason for notification failure.
The online help for each event test will, in general, have a "User Action" section that provides guidelines on how to respond to that particular event tests should it trigger. See the online help Contents page for all available event tests.
Administrators can also obtain diagnostic information about the triggered event from the "View Chart" and "Advice" functionality available from the Event Viewer.
Text description of the illustration event_vi.gif
The "View Chart" button allows administrators to look at real-time charts related to the event. The "Advice" button provides administrators diagnostic information to help them address the event condition appropriately.
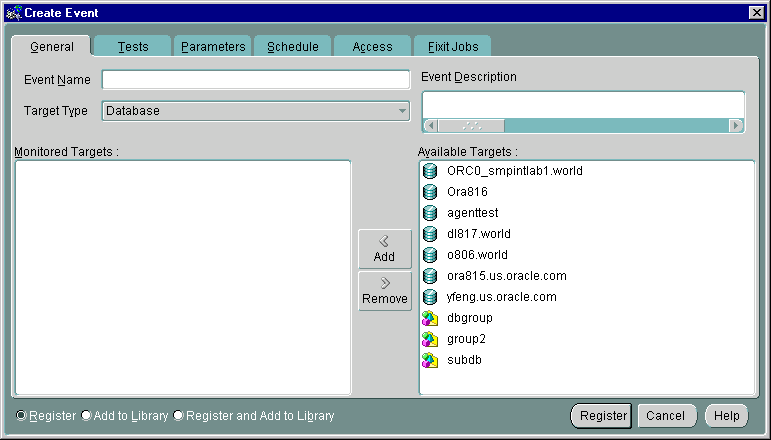
On the General page, you determine the event name, target type, description, and targets to be monitored.
Text description of the illustration eventgen.gif
Enter an event name.
Select the target type you want to monitor from the pull-down list. The types include Database, Listener, Node, or other service that is integrated into the Console.
If the selected Target Type is "Node", then a second pull-down list of operating systems will appear. If you choose `All', then event tests that apply to all types of nodes, i.e. operating systems, will be available. If you choose a particular operating system, (e.g. Solaris), then additional operating-system specific event tests will be available.
The selection of the Target Type determines the list of Available Target. If you choose "Node" and a particular operating system, such as Solaris, then the list of available destinations will show all Solaris nodes that are running at least an 8.1.7 or higher Intelligent Agent. Any Solaris nodes that use older agents will not be shown.
Events can be registered against targets that have an Intelligent Agent. Targets on manually discovered nodes cannot be used as targets for an event. Hence, these nodes will not appear on the Available Targets list. When an event is registered against a group, it will only be registered against targets that are running an Intelligent Agent. It will not be registered on any target that has been manually discovered.
Enter a description or comment for the event
On the Tests page, you determine the event tests that you want to perform. Event test are arranged hierarchically in a tree list for ease of viewing and selection. As with the Console Navigator, you can expand and compress entries in the tree list.
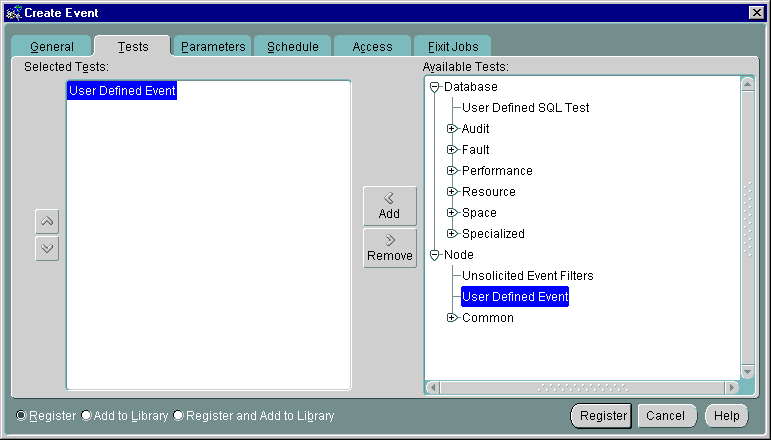
Text description of the illustration evttest.gif
Select the event tests in the list you want to perform in this event, then click on the << (Add) button to move the events to the Selected Events list. Double-clicking on an Available test will also move it to the Selected Tests list.
Select the event tests in the list you want to remove from this event, then click on the >> (Remove) button. Double clicking on a Selected test will also remove it from the Selected Tests list.
The parameter settings for the selected event tests are entered in the Parameters page of the Event property sheet. The settings and types of parameters vary according to the event test selected. Some event tests do not have parameters. See the online help for Oracle events and "Oracle Event Tests" on page 6-56 for information on tests and their parameters. Further information on event tests is available in the Oracle Enterprise Manager Event Test Reference Manual.
Text description of the illustration evtparms.gif
The parameters for an event are displayed when the event is selected in the Selected Tests list. The parameters vary according to the event selected. Some events do not have parameters.
You can accept the default values or change the values for the parameters. To enter parameter values for an event, you can enter a value directly into a parameter field.
Filtering is used in events such as Chunk Small and Maximum Extents. Examples of filters are = 'SYSTEM', LIKE '%SMP%', and IN ('SYSTEM', 'TOOLS'). Note that the quotes are single quotes. Use uppercase to match the case of the database object names. If you enter a filter value that does not select any objects or is an incorrect value, the event fails.
The Schedule page allows you to schedule the evaluation of an event condition. This allows you to schedule resource-intensive events at off-peak times.
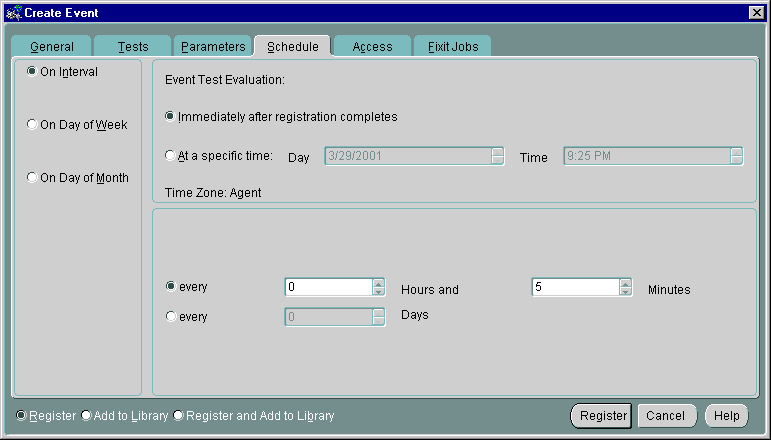
Text description of the illustration schedule.gif
You can select when you want event evaluations to occur. The choices are:
Allows you to schedule a specific time interval at which the event monitors for a specific condition. The interval can be a combination of hours and minutes, or number of days. Select the value you want to change and click on the scroll buttons. You can also type in a new value. This is the only schedule type allowed when there are targets running pre-9i Intelligent Agents in the "Selected Targets" list found on the General page.
Allows you to schedule event monitoring on one or multiple days (Sunday, Monday, etc.) of the week. Click on the days of the week to select the days you want the event scheduled. (Available for targets running 9i versions of the Intelligent Agent)
Allows you to schedule the event on one or multiple days (1 - 31) of the month. Click on the dates of the month to select the dates you want the task scheduled. (Available for targets running 9i versions of the Intelligent Agent)
If you choose a day, such as 31, that is not in a month, the event will not be evaluated in that month.
Only the Intelligent Agent time zone is available with this release. Here, the Intelligent Agent schedules event monitoring at each destination based on the actual system time of each Intelligent Agent.
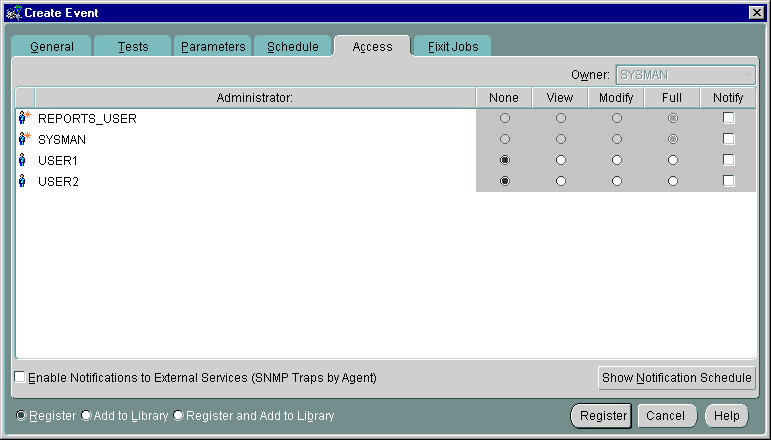
Determine the administrator access permissions that you want to assign to the event with the Access Page. This allows other administrators to view or modify the event. Notifications are also assigned with this page.
Text description of the illustration access.gif
The levels of permission that you can assign to an Enterprise Manager administrator are:
Does not allow the administrator to view this event anywhere.
Allows the administrator to view the event, inspect event properties, and receive notifications.
Allows the administrator to modify the event's log (See "Event Viewer" on page 6-42), enable enhanced notifications for other administrators, change event attributes in the event library, and assign triggered events to other administrators.
Allows the administrator to delete the event, modify permissions for other administrators, change event attributes in the event library, clear the event history, and assign triggered events to other administrators.
Allows the administrator to receive enhanced event notifications on the objects through paging or email. Other notifications will be routed to that particular administrator's Console. Notify permission cannot be assigned if the administrator's permission level is set to None.
Any permissions assigned on this page supersede any administrator default permissions. See "Access" on page 1-23 for more information. Also, the administrator's notification schedule must be set up in order for them to receive the Email/page notification. Superusers cannot be changed from "Full" permissions.
When checked, permits external notification (SNMP traps) to be sent from the supported SNMP service on the Intelligent Agent node. See the SNMP Support Reference Manual for more information.
Show Notification Schedule displays the notification schedule for the event. The schedule shown on this page is a combined schedule for all administrators that have been given "Notify" privileges for this event. To view administrators assigned to a particular time slot, use the right mouse button to call up the context-sensitive menu, choose the "Remove Recipient" option, and view the list of administrators. To add or remove notifications for an administrator, display the context menu (press the right mouse button) on any time block. The context menu provides options for adding and removing recipients of the notifications.
Table 6-3 summarized user permissions required to perform specific actions within Enterprise Manager.
A fixit job is designed to automatically correct a problem when a particular event condition is encountered. For example, you may want the Intelligent Agent to run a job to restart a database when the database instance has shut down unexpectedly. Fixit jobs are created with the Job system and must be designated as fixit jobs. The jobs must be submitted and running on the same destination that the event is set on.
The Fixit Jobs page consists of the following:
When selected, allows a fixit job to be associated with the event. When any event test in the "selected Tests" triggers, the fixit job will run.
Drop-down list containing existing fixit jobs. If no fixit jobs currently exist, click Create to display the Create Job property sheet. Note: A newly created fixit job will not show up in the drop-down list during the current editing session. The event must be closed and then re-edited before the new fixit job will appear in the list.
Displays the Edit Job property sheet for the fixit job selected in the Fixit Job drop-down list. The fixit job owner can edit some attributes of the fixit job.
Displays the Create Job property sheet which allows you to create a new fixit job.
Displays all event tests chosen for the current event.
The Event Progress page displays when you edit an event from the Registered page of the Events pane. This page provides the current registration status for the event selected: Registered, Registration Failed, Modification Pending, or Registration Pending. In addition, the target and time and date when registration was attempted is shown.
When the Progress page is displayed, it shows only the status for the selected event. If the selected event is registered, or had been submitted for registration on other targets, you can view the status of this event for those targets by selecting the desired target from the Target pull-down list. The status of the event displays for that target. To view the status of this event for all destinations simultaneously, select <All>.
The following options are available on the Progress page:
Select the destination of the event you want to view from the pull-down list. Select <All> for all destinations for which this event has either been registered or failed to be registered.
Status for the event: Registered, Registration Pending, Modification Pending, or Registration Failed.
Network destination for the event.
Date and Time the event was submitted for registration.
Displays the Event Status Message dialog. This button is active only when you have selected a failed event registration. Selecting this option will allow you to view the reasons for the failure.
Saves the contents of the list to a text file.
Oracle Enterprise Manager allows you to specify administrators that are notified when a particular event condition occurs. Each administrator can be associated with an email ID and/or a pager number. When using a paging service or email notification, each administrator can be assigned responsibility for specific systems at specific days and times.
For more information on setting up Oracle Enterprise Manager administrators, see "Managing Enterprise Manager Administrators" on page 1-8.
This section lists the Event system event tests with their parameters and return values. See "Event Parameters Page" on page 6-49 for information on entering parameter values. A list of event tests with numeric pager event Ids is also provided. See "Numeric Pager Job/Event Ids" on page 6-57 for more information.
Event tests are specified for database, listener, http, and node services. The event tests are also divided into fault, space, resource, and performance management categories. Only the UpDown event tests are included with Oracle Enterprise Manager. Additional advanced event tests are available with the optional Oracle Diagnostics Pack. See the Oracle Enterprise Manager Event Test Reference Manual for complete information on available event tests. Complete event test information is also available from online help.
Some of the database event tests, such as Chain Row, require access to system tables and require additional permissions. You need to set up preferred credentials for the monitored database with an administrator that has system privileges. See "Enterprise Manager Monitor Role" on page 6-3 and "Preferred Credentials" on page 1-25 for more information.
The Event Management System provides paging services that notify an administrator with a page when an event has occurred. Alphanumeric pagers provide a brief text message identifying the event. Numeric pagers provide the numeric pager event Ids to identify the event.
For job notifications, you will receive a 6 digit number. The first 3 digits indicate the job-id. The last 3 digits indicate job status.
For event notifications you will receive the event ID with the status code.
For a complete list of pager job/event IDs, see "Paging Status Codes for Numeric Pages" on page 1-20
Because the Enterprise Manager framework is a three-tier system that can manage a heterogeneous environment, it is important to keep in mind various software version requirements necessary for proper event system operation. Table 6-4, "Event Features and Associated Requirements" lists event system features and associated software version requirements.
|
 Copyright © 1996, 2002 Oracle Corporation. All Rights Reserved. |
|

