Release 2 (9.2)
Part Number A96598-01
 Home |
 Book List |
 Contents |
 Index |
 Master Index |
 Feedback |
| Oracle9i Real Application Clusters Deployment and Performance Release 2 (9.2) Part Number A96598-01 |
|
This chapter presents the Oracle Real Application Clusters-specific Oracle Performance Manager charts. You must install and configure Oracle Performance Manager to display the charts described in this chapter. Therefore, use this chapter as a supplement to information contained in the Getting Started with the Oracle Diagnostics Pack. This chapter contains the following topics:
See Also:
|
Oracle Performance Manager, which is part of the Diagnostics Pack, displays key performance statistics that you can monitor to optimize the performance of your Real Application Clusters database. Oracle Performance Manager presents performance data that the Intelligent Agent captures and computes. The Oracle Performance Manager charts display information from instance-specific V$ views and from global GV$ views.
Use Oracle Performance Manager to examine the performance of current as well as previous versions of Oracle cluster databases. To use Performance Manager for pre-release 2 (9.2) versions, refer to the Oracle cluster software documentation for that version.
|
Note: Some charts that were documented in the Oracle Real Application Clusters release 1 (9.0.1) documentation are no longer available for that release. |
Oracle Performance Manager has primary-level charts that you can access from icons that appear under the Cluster Database icon shown in Figure 5-1. Some of the primary charts also have lower-level charts that display performance information by instance, by file, and by object.
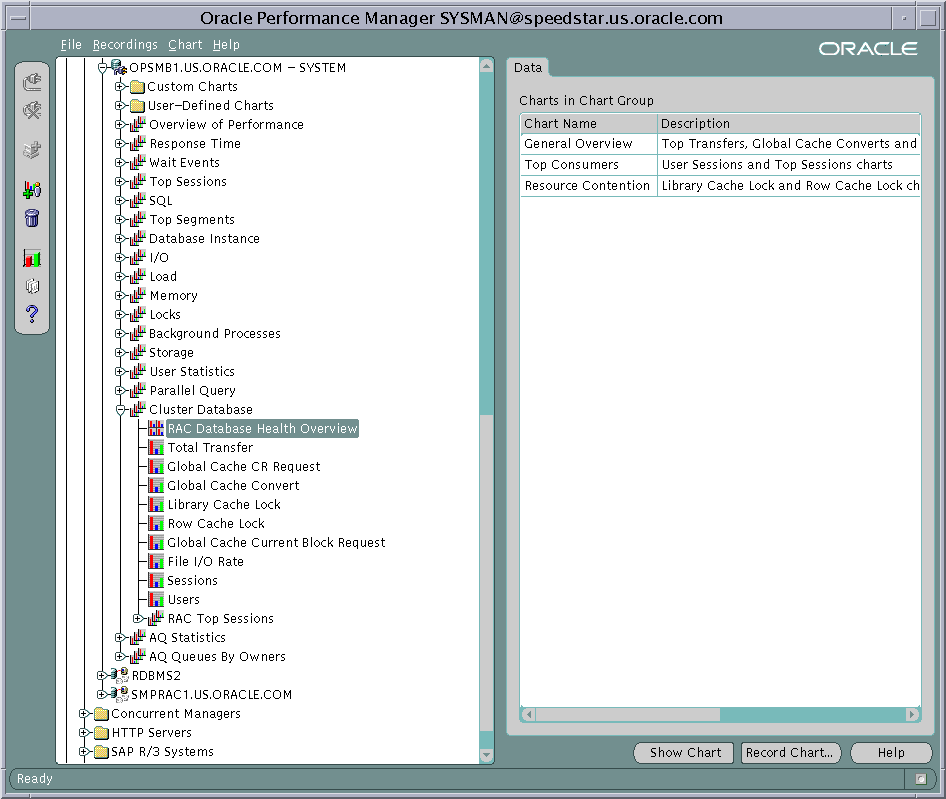
Text description of the illustration oem1.gif
Table 5-1 shows the Performance Manager chart hierarchies. You can navigate from the primary charts in the left column to lower-level charts in the right column.
| Primary Chart | Lower-Level Charts |
|---|---|
|
RAC Database Health Overview |
- |
|
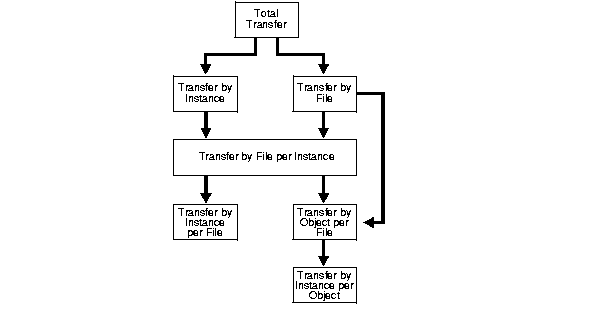
Refer to Figure 5-2 for detail about the Total Transfer chart hierarchy. |
From these two charts you can also access: Transfer By Instance Per Object |
|
Global Cache CR Request |
Global Cache CR Request By Instance |
|
Global Cache Convert |
Global Cache Convert By Instance |
|
Library Cache Lock |
Library Cache Lock By Instance |
|
Row Cache Lock |
Row Cache Lock By Instance |
|
Global Cache Current Block Request |
Global Cache Current Block Request By Instance |
|
File I/O Rate |
File I/O Rate By Instance |
|
Sessions |
|
|
Users |
Users By Instance |
|
Real Application Clusters Top Sessions |
- |
Figure 5-2 shows the chart hierarchy for the Total Transfer chart and its lower-level charts.
The primary- and lower-level charts are described under the following headings:
The Performance Manager charts in this chapter typically display rates of activities as they occur during a time interval. This section describes the following Real Application Clusters-specific charts:
The Total Transfer chart displays the rates of the following activities for the entire cluster database:
To determine these rates for each instance, drill down to the Transfer By Instance chart.
You can use this chart to analyze performance in your Real Application Clusters database as follows:
The Transfer By File chart displays the rate of transfers for consistent read blocks as well as current blocks for each datafile of your cluster database. This statistic is derived from the sum of values for 'cr_transfers' and 'cur_transfers' from the GV$FILE_CACHE_TRANSFER view. Obtain the transfer rates on per-instance basis by drilling down to the Transfer By File Per Instance chart.
Use this chart to identify the file(s) with the highest transfer rates. After selecting a file you can drill down to the Transfer By Object Per File chart to identify the objects that are subject to maximum transfers. This chart also shows you how these objects are accessed from each node. This enables you to identify the hot objects such as tables and indexes. Then you can identify a corrective action such as the use of Oracle hash or range partitioning.
The Global Cache CR Request chart displays the following statistic for the entire cluster database:
To determine the average CR request time for each instance, drill down to the Global Cache CR Request By Instance Chart.
If the chart displays a high value for CR request time, then investigate the possible causes such as a high system load, using a public interconnect instead of a private network, network errors, or poor CPU utilization by the LMS processes.
The Global Cache Convert chart displays the following statistics for the entire cluster database:
To determine these statistics for each instance, drill down to the Global Cache Convert By Instance chart and consider the following points:
The Library Cache Lock chart displays the following statistics for the entire cluster database:
To determine these statistics for each instance, drill down to the Library Cache Lock By Instance chart.
If you observe high number of lock and pin requests, then try to locate the sources for frequent PL/SQL unit execution, high amount of parsing, or the inefficient use of bind variables.
If you observe a high number of invalidations, then try to locate DDL statements or PL/SQL compile commands that result in schema objects being analyzed, dropped, or altered.
The Row Cache Lock chart displays the following statistics for the entire cluster database:
To determine these statistics for each instance, drill down to the Row Cache Lock By Instance chart. The statistics on this chart highlight any dictionary contention. If you observe a high percentage of DLM conflicts, then investigate the sources of dictionary contention, such as dictionary managed tablespaces, uncached sequences, or the frequent creation and dropping of database objects.
The Global Cache Current Block Request chart displays the following statistics for the entire cluster database:
To determine these statistics for each instance, drill down to the Global Cache Current Block Request By Instance chart. A high value for the serve time is generally attributed to poor performance of the LMSn processes. Just as for the average global cache CR request time, high values of average current block request and serve times can be caused by a high system load, the use of a public interconnect, network errors, the low priority of LMSn processes , or poor CPU utilization by the LMSn processes.
The remaining charts in this chapter are clusterized versions of single-instance Oracle database charts. The charts described in this section are:
The File I/O Rate chart displays the rate of physical reads and writes for all files in the cluster database. To determine the rate of reads and writes per datafile, drill down to the File I/O Rate By Object chart. To determine the rate of reads and writes per instance, drill down to the File I/O Rate By Instance chart.
The Sessions chart displays the sessions attached to the entire cluster database as well as related information, such as instance name, session ID, process ID, status, and user name.
The Users chart displays the following for the entire cluster database:
To determine the number of logged-on and active users for each instance, drill down to the Users By Instance Chart.
The Real Application Clusters Top Sessions chart displays a set of sessions with the highest contribution to the cluster database instance activity based on selected sort statistics.
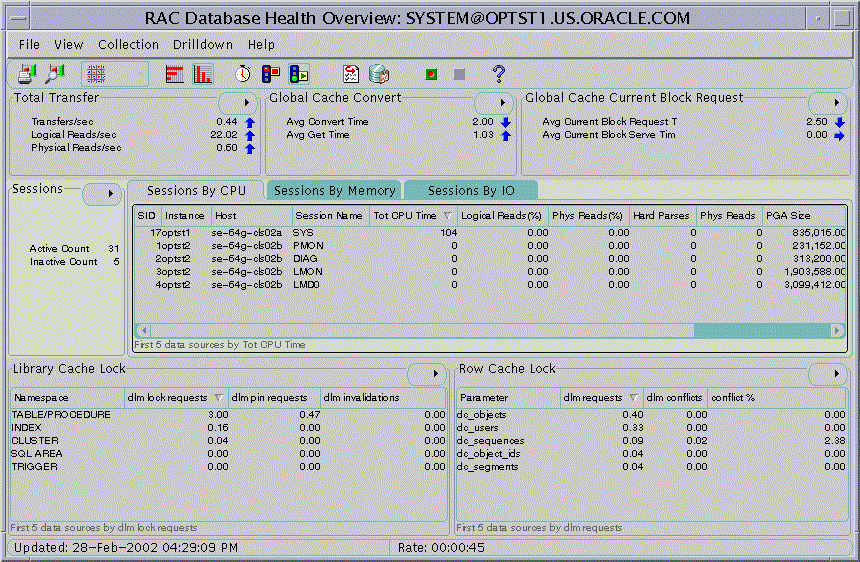
Figure 5-3 displays the Real Application Clusters Database Health Overview chart which is a group of standalone charts that shows key performance statistics for the entire cluster database. This chart consists of the following standalone charts:
Drill downs from these charts are available in the same manner as the drill downs are available when these charts are used as standalone charts. In addition, the center of the overview chart contains a clusterized version of session information that is not available as standalone chart. You can customize the display of sessions information based on CPU, Memory, or I/O.
|
Note: You can also display this overview chart from the Enterprise Manager Console by selecting the menu item Performance View from the right-mouse menu of a cluster database. |
|
 Copyright © 1999, 2002 Oracle Corporation. All Rights Reserved. |
|

