Release 9.0.1
Part Number A88720-01
 Home |
 Book List |
 Contents |
 Index |
 Master Index |
 Feedback |
| Oracle Enterprise Manager Getting Started with the Oracle Management Pack for Oracle Applications Release 9.0.1 Part Number A88720-01 |
|


Oracle Capacity Planner is an Oracle Enterprise Manager application that allows you to collect different types of performance statistics and record that data in an historical database. You can then use Oracle Capacity Planner to analyze the historical data to plan future capacity.
Oracle Capacity Planner uses the Intelligent Agent (Agent) to collect its historical data. To collect most types of data, you must install the Agent on the system (or systems) where you want to collect data. See the Oracle Intelligent Agent User's Guide for information on managing the Agent.
If you are using Oracle Capacity Planner to collect concurrent manager data, the Agent can be installed on another system.
The types of performance data that Oracle Capacity Planner can collect on a system depend on the products that are installed. Table 4-1 shows the types of data that Oracle Capacity Planner can collect when various Oracle products are installed. The number of targets that appear in the Capacity Planner navigator tree will also vary, depending on the number of applications you have installed.
If additional products from Oracle are installed, Oracle Capacity Planner may be able to collect additional types of data not shown in Table 4-1.
The following list identifies how Capacity Planner uses the Agent to collect performance data:
The Agent stores the data in an efficient binary form.
The Agent also aggregates the data by time, creating summary statistics for the data that is collected at different time intervals (hour, day, week, and so on).
Purging the historical data allows you to have access to a current view of recent performance data for your environment and to manage the amount of stored data to avoid wasting disk space.
Oracle Performance Manager relies on the Agent to monitor a target (such as a node, a database, or a concurrent manager). Usually, the collection of the data is done on the system where the target is located. However, for some types of targets Oracle Performance Manager can also monitor data on a system by using the Agent on another system (an intermediate host).
This intermediate host could be the client system where the Oracle Performance Manager is running, or any other system on the network on which the Agent is available.
There are three ways to set the location of the Agent. The method you use depends on how you connect to the target. Consider the following scenarios:
Capacity Planner attempts to connect to the Agent on the host where the target is located. If this connection fails or cannot be attempted because no preferred credentials have been set for the database, you will be prompted with a dialog box containing logon credentials for the database. You can use the Connection Details dialog box to specify the location of the Agent that will be used to collect performance data.
Capacity Planner displays a Logon dialog box. This dialog box also contains a field to specify the location of the Agent that will be used to collect performance data.
Capacity Planner displays the Database Logon dialog box for the selected target. This dialog box also contains a field to specify the location of the Agent that will be used to collect performance data.
Oracle Capacity Planner can perform tasks such as the following:
You can start Oracle Capacity Planner in any of the following ways:
./oemapp cp
Enter the appropriate connect information for your Oracle Enterprise Manager repository, then click OK.
When you are using Oracle Capacity Planner, you can display context-sensitive help topics. You can also display conceptual topics and task topics.
To obtain context-sensitive help for an Oracle Capacity Planner panel, window, dialog box, or property page, select an item in the panel, window, dialog box, or property page, then on the Help menu, choose Window.
To obtain context-sensitive help for a class, chart, or data item on a property page, select the class, chart, or data item on the property page, then take one of the following actions:
If a help topic is not available for a class, chart, or data item, a No Help Available message is displayed when you request help.
|
Note: Not all the charts described in the appendix are available from within Oracle Capacity Planner. |
To view the Contents page for the Oracle Capacity Planner help, on the Help menu, choose Contents. On the Contents page, you can:
Conceptual topics provide conceptual or overview information of which you should be aware before performing a particular Oracle Capacity Planner task. Conceptual topics do not contain step-by-step information for performing a task.
Task topics provide step-by-step instructions for accomplishing an Oracle Capacity Planner task. They do not provide conceptual information that you should be aware of before performing the task.
You can access a glossary of Oracle Capacity Planner terms by double-clicking the Oracle Capacity Planner Glossary book on the Contents page.
You may find it helpful to think of using Oracle Capacity Planner as a two-step process:
See "Setting Up a Collection" for a detailed description of how to collect historical data.
See "Analyzing Collected Data" for a detailed description of how to analyze collected data.
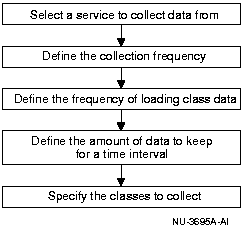
To set up a historical data collection with Oracle Capacity Planner, you:
Figure 4-1 shows the steps to follow when setting up a collection. For more information on each step, see the following sections.
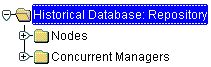
You can select one or more targets from which you want to collect historical performance statistics. For example, when you have the Management Pack for Oracle Applications installed, the target types are typically Nodes and Concurrent Managers.
The procedure for selecting a target depends upon whether or not the server resides on a node that is known to the Enterprise Manager main console. A node is known to the console when it has been discovered with the Enterprise Manager console Discover Nodes command.
To select a target on a node that has been discovered by the Enterprise Manager console:
The Oracle Capacity Planner navigator tree displays the targets of the selected type that are known to the Oracle Enterprise Manager main console.
When you connect to a target in the Oracle Capacity Planner navigator panel, you may be prompted for credentials if they are required to connect to that target. If a logon dialog box appears, click Help for information on the individual fields on the dialog box.
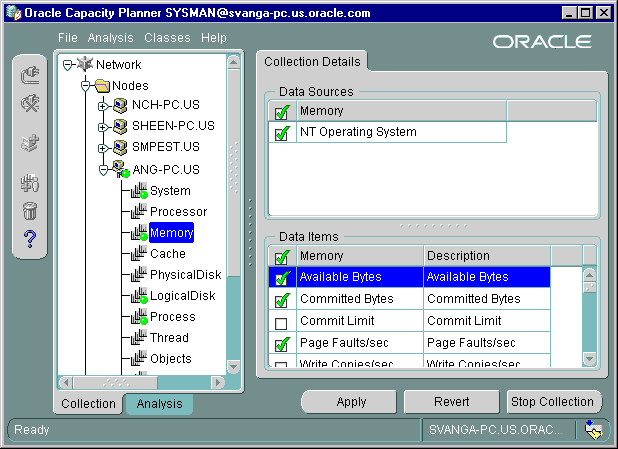
After you connect to a target, the available collection classes for that target appear in the navigator and Oracle Capacity Planner displays the Target property sheet for the selected target. For example, Figure 4-2 shows the classes that appear when you connect to a Windows NT node target.
If you double-click a target type and the target you are looking for does not appear in the target type folder, you can do one of the following:
This is the preferred method for adding a target to the Capacity Planner navigator panel. When you discover a node with the Enterprise Manager console, Capacity Planner saves key information about the target, such as the preferred credentials, location of the Agent, and historical database information.
When you add a target manually, the target is added for the current session of Capacity Planner only. You can start gathering data for the target, but the next time you start Capacity Planner, the target will not appear in the navigator panel. To modify collection settings or analyze data collected for the target, you will have to add the target again the next time you start Capacity Planner.
To add a target manually:
Capacity Planner displays a message to remind you that targets you add manually will be available for the current session of Capacity Planner only.
Capacity Planner displays a logon dialog box for the target. Click Help if you need information about any of the specific fields on the dialog box.
After you connect to a target, the available collection classes for that target appear in the navigator and Oracle Capacity Planner displays the Target property sheet for the selected target (Figure 4-2).
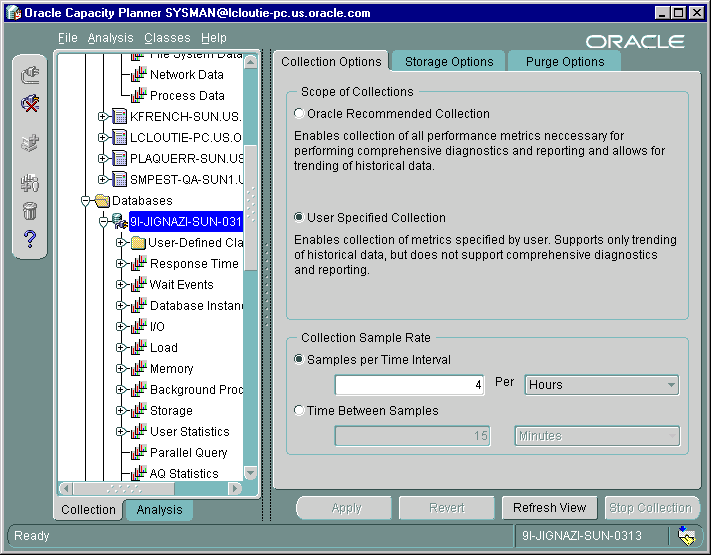
When you connect to a target, Oracle Capacity Planner displays the Target property sheet, which contains the following property pages:
The collection, load, and purge settings you select on these pages apply to all the classes in the selected target. You cannot change these settings for a selected class; you can change them only for a selected target.
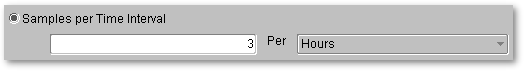
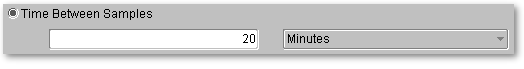
When you first connect to a target, Capacity Planner displays the Collection Options property page. The values you select on this page determine how often the Agent will collect information about the selected target and save it to disk. On the Collection Options property page, you can set the frequency of collection samples using either of these two methods:
For example, to collect information 3 times every hour, select Samples per Time Interval, enter 3 in the text field, and choose Hours from the drop-down list.
For example, to collect information every 20 minutes, select Time Between Samples, enter 20 in the text field, and choose Minutes from the drop-down list.
After you set the frequency of collection samples, use the Storage Options tab to specify the location of the Oracle Capacity Planner historical database. This setting defines where Capacity Planner will save information collected for the selected target. When data is saved in the historical database, you can later analyze the data or use it to generate trend analyses.
By default, collected data is saved in your Oracle Enterprise Manager repository. However, you can specify an alternate database for the historical data if you do not want to store historical data for the selected target in the repository.
To save the data collected for a target in a location other than the Oracle Enterprise Manager repository:
Enter the appropriate user name, password, and target for the Oracle Capacity Planner historical database. This connection information is used by the Agent when it loads the collected data at the specified loader interval. Therefore, the target specified for the Oracle Capacity Planner historical database must be known and accessible from the host where the Agent is running.
For example, if you specify MY_DB.WORLD as the historical database and your Agent is running on host MYNODE, then database MY_DB.WORLD must be reachable via Net8 or SQL*Net from host MYNODE (MY_DB.WORLD must exist in the TNSNAMES.ORA file for host MYNODE, for example).
After you define how often data will be collected and where the data will be stored, you can define how often the data will be loaded into the historical database.
You can determine how frequently the Oracle Capacity Planner loader program loads collection data for the target using either of these two methods:
The collection frequency you set determines the lowest time interval for which Oracle Capacity Planner can analyze data. For example, if you want to be able to analyze data from hourly intervals, you need to set a collection frequency of at least once an hour.
After you define the frequency of loading collection data, you can set a time for the next loader pass by using the Next Transfer Occurs at field:
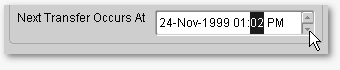
Text description of the illustration cp_next_transfer_field.gif
If the current time is later than the time displayed for the Next Transfer Occurs at setting, click Refresh View to update the display to show the actual time of the next loader pass.
Note that the values that you select on the Storage Options property page apply to all classes of data collected on the selected target.
The loader runs at the regular time interval specified on the Storage Options property page. The time specified in the Next Transfer Occurs at field controls when the loader runs. For example, if you want the loader to run once a day at 2:00 a.m., then set the transfer interval to once per day, and set the next transfer time to the next day at 2:00 a.m. The loader will run for the first time at 2:00 a.m. the next day, and then will run once a day, each day at 2:00 a.m.
You can use the Next Transfer Occurs at field to force the loader to run immediately--or as soon as possible. Simply set the next transfer time to a time earlier than the current time.
As it loads data into the database, Oracle Capacity Planner automatically aggregates the data. During aggregation, Oracle Capacity Planner examines the collection samples for a given time interval, calculates an average value for that interval, then uses that average value for calculations at the next larger time interval.
On each loader pass, Oracle Capacity Planner examines the time stamps of all collected data to determine whether or not the threshold for a set interval (hour, day, week, month, or year) has been crossed since the previous loader pass. If so, Oracle Capacity Planner performs an aggregation of collected data from the next smaller interval to the interval threshold just passed. Table 4-2 shows the larger time interval to which data at each time interval is aggregated.
| Data at This Interval | Aggregates to This Interval |
|---|---|
|
Minutes |
Hours |
|
Hours |
Days |
|
Days |
Weeks |
|
Weeks |
Months |
|
Months |
Years |
An example may help clarify how Oracle Capacity Planner aggregates collection data. Suppose Oracle Capacity Planner is collecting a data sample every 10 minutes to capture the percentage of used space on a particular disk, and the loader runs once an hour. When the Oracle Capacity Planner loader runs and transfers data into the Oracle Capacity Planner database every hour, it examines the values for the percentage of used disk space in the samples collected during the previous hour, then it computes an average percentage for the samples. That average percentage is then used as the average value for the hour.
At the first loader pass after midnight, Oracle Capacity Planner uses the hourly averages since midnight the previous day to compute the day's percentage of used disk space.
At the first loader pass after midnight on Saturday, Oracle Capacity Planner examines the daily averages of used disk space since midnight the previous Saturday and computes an average percentage for the week.
At the first loader pass after midnight on the last calendar day of the month, Oracle Capacity Planner examines the weekly averages since midnight on the last calendar day of the previous month and computes an average percentage for the month.
Finally, at the first loader pass after midnight on December 31, Oracle Capacity Planner examines the last 12 monthly averages to compute a yearly average.
The final step in setting up a target for historical data collection is defining the amount of data to keep.
When you select a target, you can click the Purge Options tab to display the Purge Options property page. On this page, you specify the amount of data you want to store in the Oracle Capacity Planner historical database for each type of data (for example, hour data, day data, and week data). You can accept the default Purge Options property page values or choose different values.
The values set on the Purge Options property page apply to all classes of data collected on the selected target.
The values you specify in the data retention table (the Enter the amount of data you want to keep table on the Purge Options page) determine how far back in time you can go to analyze data for the different types of data.
Suppose, for example, you always want to be able to view hour data for the previous six weeks. In this case, for the Hours Data Type row in the data retention table, you would enter 6 in the Timespan column and Weeks in the To Keep column. This tells Oracle Capacity Planner that you want to keep hour data for a 6-week period. Oracle Capacity Planner calculates 6 weeks from the current time, and the Purge Data Older Than column shows the time span for which hour data is available. Table 4-3 shows the Hours row in the data retention table with this data entered.
| Data Type | Timespan | To Keep | Purge Data Older Than |
|---|---|---|---|
|
Hours |
6 |
Weeks |
(current date minus 6 weeks) |
For each row in the data retention table, you can choose the time span to keep data samples for that type of data by entering the desired value in the Timespan to Keep column.
When you finish setting all the options on the Target property sheet, do the following to apply your collection settings:
If you changed the location of the historical database on the Storage Options page, Capacity Planner displays a message box reminding you that any information stored in the previous location will not be available for analysis.
If you don't want to be reminded about this implication the next time you change the database location, select Don't show this message again.
Capacity Planner displays a message stating that the options were set successfully.
When you apply your collection settings, Capacity Planner sends the settings to the Agent for the selected target. Note that you cannot select data to be collected until these settings have been applied.
At any time during the process of modifying the settings on the Target property sheet, you may revert the settings to their last saved (applied) state by clicking Revert. However, after you apply the settings, they cannot be reverted to their previous settings using the Revert button; they must be modified manually.
After you set the collection and loading options for a target, you can then select the classes of performance data that you want to collect for that target:
For more information, see "Selecting Targets" .
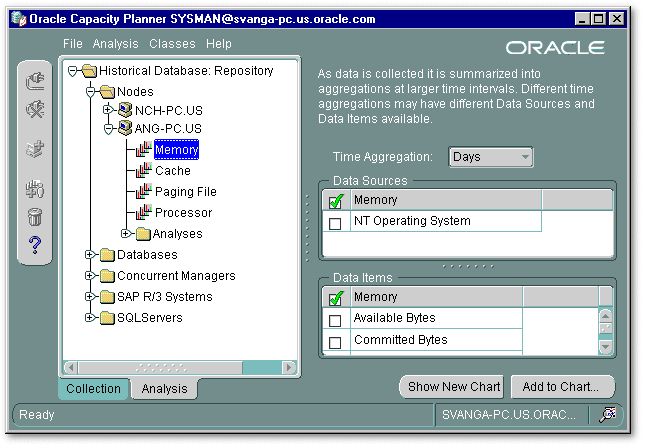
Figure 4-3 shows a typical collection class for a node target on Windows NT and the data sources and data items available for the class.
The following list explains classes, data items, and data sources in more detail:
A class is a container for a particular category of data. For example, a node (or operating system) target might include the following classes:
When you select a target in the navigator, Capacity Planner displays the names of the classes below the target in the tree view.
You can collect data from none, some, or all displayed classes for a target. A class may also be a container for other classes, to provide logical groupings of the performance data at higher levels. For example, an I/O class may be a container for other more specific I/O classes.
In a class, each of the related statistics is referred to as a data item. For example, a LogicalDisk class might include the following data items:
A class can contain one or more data items. When you select a class in the navigator, the names of the data items and data sources associated with the data items are displayed on the Collection Details property page. Select the data items that you are interested in collecting.
A green check mark appears next to the name of each data item that is selected for collection. You can toggle the state of all data items between collected and not collected by clicking the Data Items column header that contains the check mark.
A data source is a description of where Oracle Capacity Planner can collect the data items for a class. A class can contain one or more data sources. When you select a class in the navigator, the names of the data items and data sources associated with the class are displayed on the Collection Details property page.
The type of data in the class determines the data sources for the class. For example, in a LogicalDisk class, the data sources might be the individual disks for the operating system (for example, disk1, disk2, and so on). In a CPU Utilization class, the sources are the individual CPUs for the host (for example, cpu1, cpu2, and so on). You can collect data items from one or more data sources.
When you select a data source, a green check mark appears next to the name of the data source on the Collection Details property page. You can toggle the state of all data sources between collected and not collected by clicking the Data Sources column header that contains the check mark.
After you select the data items that you want to collect from the available data sources on the Collection Details property page, click Apply to confirm your selections, or click Revert to cancel the selections.
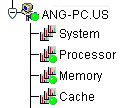
When you click Apply for a class of data, Capacity Planner marks the icon for the selected class and the selected target with a green dot in the Collection view of the navigator panel. A green dot on a collection class icon indicates that one or more data sources are selected for the class. A green dot on a target icon indicates that Capacity Planner is collecting data for one or more classes in the target.
For example, in Figure 4-4, Capacity Planner is actively collecting data for the Processor, Memory, and Cache classes for node ANG-PC. Capacity Planner is not collecting data for the System collection class.
To stop collecting data for one or more data items or data sources for a collection class, follow these steps:
To stop collecting data for all data items and data sources for a collection class, follow these steps:
Capacity Planner displays a message box stating that collections for the class have stopped.
When no data sources are selected for collection for a class of data, the icon for that class in the navigator does not display a green dot.
To stop collecting data for all classes in a target:
For more information, see "Selecting Targets" .
Capacity Planner displays a confirmation box.
A collection report provides a summary of the collection settings for one or more targets. Capacity Planner displays the collection settings in your Web browser. In the browser, you can easily review the settings currently applied to the target or targets you selected.
To display a collection report for one or more targets:
Capacity Planner displays the first screen of the Collection Report Wizard.
At any time while using the wizard, click Help for more information.
When you click Finish on the last screen of the Collection Report Wizard, Capacity Planner saves the report to an HTML file and displays the report in your Web browser.
After you set up collection settings for one service, you can quickly copy those settings to another similar target.
To copy the collections settings from one target to another:
Capacity Planner displays the first screen of the Copy Collections Wizard.
From the wizard, you can also view the progress of the copy operation. At any time while you are using the Copy Collection Settings Wizard, click Help for more information.
During the collection and load processes, errors may be encountered by the Agent. You can determine if data is not being collected or loaded by using either of these methods:
If data is not being collected or loaded, you should check the status of the Agent on the host from which data is being collected. If the Agent is running, check the log file ($ORACLE_HOME/network/log/dbsnmp.log) for errors related to the collection or loading of data. See the Oracle Intelligent Agent User's Guide for additional details on the configuration of the Agent.
After collected data is loaded into the Oracle Capacity Planner historical database, you can perform a variety of analyses on it. To access the analysis features of Oracle Capacity Planner, click the Analysis tab (Figure 4-5) at the bottom of the Oracle Capacity Planner navigator tree view. This displays the Oracle Capacity Planner analysis view.

When you expand the Historical Database folder at the root of the navigator tree in analysis view, you are prompted for the logon credentials for an Oracle Capacity Planner historical database.
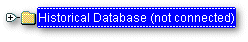
After you connect to a historical database, the folder expands to show the targets for which data is available in that historical database.
If you store data in multiple historical databases, you must disconnect from one historical database before you can connect to a different historical database.
To disconnect from the current historical database,
To connect to a different historical database, expand the Historical Database folder again and enter the credentials for the new historical database in the resulting logon dialog box.
When you expand a target in the navigator under the Historical Database folder, two forms of data are displayed below the target:
The classes displayed for the target are the collection classes for which data is available in the Oracle Capacity Planner historical database. You can select and view data from these classes by selecting a class in the navigator, specifying the selection criteria, and then clicking Show New Chart. These operations are the first step in creating an analysis.
Below each target in the navigator is an Analyses folder, which contains predefined and user-defined analyses. Predefined analyses are provided for some targets. You can create user-defined analyses by selecting a class of data, displaying an analysis of the data, and then saving the analysis. You can also create a user-defined analysis by using an existing analysis as a template, making modifications to the analysis, and then saving the analysis under a new name.
To browse the collected data for a particular target:
You are prompted for the credentials for the historical database that contains the collected data that you want to analyze.
The navigator displays the:
To view an analysis chart for a selected class of data:
Capacity Planner displays the property page for the class (Figure 4-6).
Capacity Planner displays the Analysis window, which contains two or more pages. The Chart page displays the chart. The remaining pages are Details pages. A separate Details page exists for each class from which one or more data items are included in the analysis.
For information about the Analysis window, choose Window from the Analysis window Help menu. For information about modifying the analysis or changing the way the data is displayed, see "Working with Analyses" .
After you view an analysis for a class of data, you can save it as a user-defined analysis to view later.
To save the analysis:
Performance Manager places the new user-defined analysis in the Analyses folder of the navigator panel.
When you select a class in the navigator panel in analysis view, Capacity Planner displays a property sheet that contains options available for selecting data from the Oracle Capacity Planner historical database for that class.
Before you display a chart of the collected data you must:
For example, select Hours if you want to analyze hourly data, Days if you want to analyze daily data, and so on.
A check mark appears next to each data item that is selected for analysis.
After you specify the selection criteria, there are two ways to display the data in an analysis chart:
You can view and modify both user-defined and predefined analyses. However, once modifications are made to a predefined analysis, the only way to save those changes is to save the analysis to a new name. This creates a new user-defined analysis and preserves the original predefined analysis.
To view an existing analysis, which makes it available for modification, follow these steps:
A bar chart icon identifies a predefined analysis. Not all targets provide predefined analyses.
A bar chart and person icon identifies a user-defined analysis. You create a user-defined analysis by displaying an analysis for a class of data or displaying a predefined analysis, and then saving the analysis.
The Analysis Summary property page for the selected analysis is displayed in the detail panel. This property page displays the names of the targets and classes whose data is used in the analysis.
Note that if you are opening a predefined analysis, Capacity Planner displays the Select Data Sources for Analysis dialog box. Predefined analyses are provided for some targets. Predefined analyses require you to specify the available data sources for your installation. Select the data sources you want to include in the predefined analysis and click OK.
After you have opened an analysis, you can modify the contents and how they are presented. See "Working with Analyses" for more information.
You can also create a copy of an analysis, rename an analysis, or delete an analysis, as explained in the next three sections.
You can create an analysis that is an exact copy of an existing analysis, but the copy has a different name. To do this:
Capacity Planner creates the new copy of the analysis in the Analyses folder for the target.
|
Note: You cannot rename a predefined analysis. This restriction ensures that the original predefined analysis charts are not overwritten. However, after you make changes to a predefined analysis, you can save the modified version of the predefined analysis as a user-defined chart with a new name. For more information, see "Saving the Results of a Predefined Analysis". |
To rename a user-defined chart:
A bar-chart-and-person icon identifies user-defined analyses.
To delete a user-defined analysis:
A bar-chart-and-person icon identifies the user-defined analyses in the folder.
After you have opened an analysis chart, either by selecting and showing an existing analysis or by browsing collected data to create a new analysis, the data included in that analysis is shown in the Oracle Capacity Planner Analysis window.
The Analysis window contains two or more pages. The first page is called the Chart page and it displays the analysis chart. The remaining page or pages are Details pages. A separate Details page exists for each class from which one or more data items are included in the analysis. Each Details page shows the:
The time range for the collected data appears along the bottom of each chart, with the beginning of the time range at the left and the end of the time range at the right.
Two types of lines can appear on a chart. Each solid line plots the values of a selected data item during the specified time range. Each dashed line plots the result of a trend analysis to time or trend analysis to value. See "What Is a Trend Analysis?" for more information about performing a trend analysis.
The rest of this section describes other features of the Analysis window.
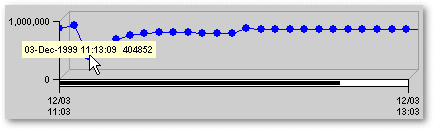
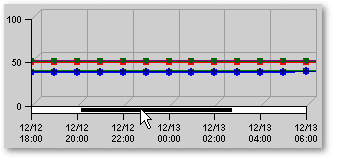
To view the value for a data point (that is, one plotted point of a data item) on a line in an analysis chart, position the cursor over the data point. If there is a point beneath the cursor, Capacity Planner displays the date, time, and value for that data point displays in a box above the point (see Figure 4-7).
When you view an analysis chart, you can perform certain operations after selecting a line in the chart. Most of the available operations are started by clicking a toolbar button on the analysis window after a chart line is selected.
To select a line, click a data point on the line. When a line is selected, the description of the line is displayed in the status bar at the bottom of the window, and the appropriate toolbar buttons are enabled.
Operations available from the toolbar are also available on a context menu. To display the context menu, click the right mouse button on a data point in a line in the analysis chart.
To be sure which line is currently selected (before clicking a toolbar button), read the description of the line in the status bar.
After you open an analysis, you may want to add data from other classes to the analysis. You can use this feature to compare two different classes of data.
To add a class of data to an analysis that is currently displayed in the Analysis window:
You can add data items from multiple classes to an analysis, and you can select different aggregation levels and date ranges for each class.
However, data items within a single class must share the same aggregation level and date range. If you try to add additional data items from the same class to an existing chart, you will receive a prompt, warning that the chart already contains data from this class. If you click OK, Capacity Planner will overwrite the chart with the currently selected data, aggregation levels, and date range.
From the analysis window, you can modify the selection criteria associated with any of the classes of data included in the analysis. Modify the selection criteria using one of these methods:
These actions display the Select Items dialog box, which contains the property sheet for the class of data associated with the selected line. This property sheet contains the selection criteria for that class of data, which you can modify and apply to the current analysis. See "Specifying Selection Criteria for a Class of Data" for more information.
After you modify selection criteria, you can click either Apply or OK on the Analysis Options dialog box. If you click Apply, the changes made to the selection criteria are applied to the analysis and the updated analysis is shown. The Select Items dialog box remains displayed, and you can make other modifications to the same selection criteria, if you want. If you click OK, Capacity Planner applies the modifications to the analysis and closes the Select Items dialog box.
You can remove a line from an analysis chart by either of these methods:
These actions remove the data for the selected data item from the chart, but not from the historical database.
You can exclude a data point (that is, one plotted point of a data item) from a chart. To exclude a data point, click the right mouse button on the data point and choose Exclude Point from the context menu.
Excluding a data point is useful if you know that the value of a particular data point is skewed. For example, if you know that a particular CPU-intensive program was not run at the usual time, you can remove the value for the % Processor Time data item for that time from the chart. The selected data point is removed from the chart, but the data for the data point is not removed from the historical database.
After you exclude one or more data points from a line, a red X appears in the status bar when you select the line.
To later redisplay excluded data points for a selected line, click View Exclusions on the Analysis window toolbar, or click the right mouse button on the line and select View Exclusions from the context menu.
These actions display the Data Point Exclusions dialog box, which displays the current list of excluded points for the selected line. You can toggle the check mark for each data point in the list. A check mark indicates that the data point is excluded from the analysis. To display an excluded data point in the analysis again, clear the check mark.
When you click OK, Capacity Planner closes the Data Point Exclusions dialog box and updates the chart to include the points removed from the list of exclusions.
You can control whether or not the legend is displayed in an analysis chart by toggling the Show/Hide Legend button on the analysis window toolbar. When the legend is not shown, you can identify a line by clicking it, which displays the description of the line in the analysis window status bar.
Depending on the date range and the number of data items and data sources you are analyzing, you may want to zoom in, zoom out, or scroll the contents of the chart window.
To view more detail or less detail, click the Zoom In and Zoom Out buttons on the Analysis Chart window toolbar. You can also zoom in by pressing the Page Down key on your keyboard or the numeric 3 on your keypad, and you can zoom out by pressing the Page Up key or the numeric 9 on your keypad.
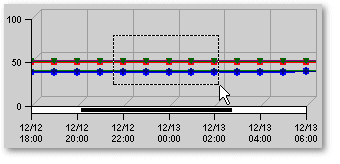
You can also zoom in on a very specific part of the chart by dragging a rectangle around the area you want to magnify (Figure 4-8). Release the mouse button to zoom in on the selected area. You can zoom back out by using the Zoom Out button Home or End key on your keyboard.
Often, the chart data will extend beyond the width of the Analysis Chart window. You can view the data that extends beyond the edges of the window by resizing the Analysis Chart window or by scrolling to the right or left.
To scroll the Analysis chart window:
Optionally, you can use the arrow keys on your keyboard to scroll left and right. Press the left arrow to scroll left and the right arrow to scroll right. If you experience a conflict with the Tab function using the left and right arrow keys, you can use the up and down arrow keys on your keyboard to scroll. Press the up arrow to scroll left (or the numeric 8 on your keypad), or the down arrow key to scroll right (or the numeric 2 on your keypad).
If an analysis contains data from different classes where the scale of the data is significantly different, you may want to apply scaling to the data. Scaling normalizes the data so that all lines have a maximum value of no greater than 100. Very large data items are scaled down, and very small data items are scaled up.
To apply scaling, click Toggle Auto Scaling on the analysis window toolbar. When scaling is applied to a chart, data lines with very different scales may be visually correlated. When scaling is enabled, Capacity Planner displays the label Scaled Data along the Y-axis of the chart. If you select a line from the chart by clicking it, the scaling factor for that line is included in the status bar.
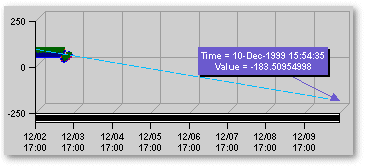
A trend analysis infers or estimates future values by projecting and extending known values. Oracle Capacity Planner can perform the following types of trend analyses:
In a trend analysis to a point in time, you provide a goal time for a data item. Oracle Capacity Planner uses the specified values in the historical database to project the value of the data item at the goal time.
A trend analysis to a point in time is used to answer questions such as, "How full will this disk be at the end of the year?"
In a trend analysis to a value, you provide a goal value for a data item. Oracle Capacity Planner uses the specified values in the historical database to project the time at which the data item will reach the goal value.
A trend analysis to a value is used to answer questions such as, "When will our CPU utilization reach 95 percent?"
As the default, the Capacity Planner Trend Analysis wizard uses the critical threshold for the metric (if one is defined) when you perform a trend to a value.
To specify and perform a trend analysis, follow these steps:
Both of these methods display the Trend Analysis Wizard.
This option is enabled only if you zoomed in to see more detail in the chart. For more information, see "Zooming and Scrolling to View More or Less Chart Data" .
Use the Annotate Trend dialog box to specify whether Capacity Planner will annotate the trend analysis (see Figure 4-10) and the appearance of the trend analysis line in the chart window. If you need information about the fields in the Annotate Trend dialog box, click Help.
You can save the changes you make to an analysis. Oracle Capacity Planner can determine if you are saving a user-defined analysis or a predefined analysis. The steps for saving your changes differ, depending on the type of analysis.
To save changes to a user-defined analysis:
Your changes are saved to in the Analysis folder for the selected target using the current name of the analysis or data class. To save the analysis under a different name, choose Save As from the Analysis window File menu.
If you modify a predefined analysis, you must provide a new name for the analysis when you save the results of the analysis. When you do this, you create a new user-defined analysis. Saving the analysis with a new name ensures that the original predefined analysis is not overwritten.
To save the results of a predefined analysis:
Capacity Planner places the new user-defined chart in the Analyses folder of the navigator panel.
To print an analysis chart, click the Print Chart button in the Analysis Chart toolbar while the chart is displayed.
The size of the chart on the screen determines the size of the chart in the chart printout. For example, when you print a chart that is 5 inches high and 7 inches wide on your screen, the chart will be 5 inches high and 7 inches wide in the printout.
To generate an HTML report for an analysis chart:
Capacity Planner displays a dialog box that tells you the name of the HTML file used to display the report and where the file will be saved.
You can view the report later using a Web browser, or--if you have experience with Web publishing tools and techniques--you can share the report with your co-workers by publishing the HTML file and its associated graphic files on a Web server.
The logical structure of the Oracle Capacity Planner historical database schema was designed to facilitate querying of capacity planning data by tools other than Oracle Capacity Planner, such as Microsoft Excel. This section contains a brief description of the design of the Oracle Capacity Planner historical database schema. It is not intended to be a comprehensive description of all tables and columns in the schema.
The service reference table contains a list of all targets for which data has been stored in the Oracle Capacity Planner historical database. The HOST column contains the name of the host where the Agent that loaded data for the specified target (the NAME column) is located. The SVC_ID column is a column used for lookup into the class reference table, described in the following paragraph.
The class reference table contains a list of all collection classes for which data has been stored in the Oracle Capacity Planner historical database, for all targets. To see the list of classes for a particular target, a query should look for the SVC_ID column equal to a SVC_ID value from the service reference table, described in the previous paragraph. Such a query would produce a list of all classes for which data exists in the database for a particular target.
Each class of data in the class reference table has six data tables that contain the data for that collection class. Each table contains data for a particular time aggregate, for example, hours, days, weeks, months, and years. The base table contains the raw data as it is collected at the collection frequency. Therefore, the base table does not contain any statistical aggregations. The aggregate tables contain aggregate statistics for each data item collected for that class.
Data tables are named according to the first four columns of the class reference table (in reverse order) plus the aggregate. Example 4-1 shows an entry for a collection class in the class reference table.
CLS_ID      MOD_ID     SVC_ID     IS_UDS      CONTAINER_CLASS_LABEL
---------- ---------- ---------- ---------- -------------------------------
         8          2          2          0 I/O
The collection class in Example 4-1 would have the data tables shown in Example 4-2.
The first two columns of each data table are always the Timestamp column and the Data Source Name column. The Data Source Name column is essentially the class name, for example, Logical Disk. In aggregate tables (tables other than BASE), the third column is an accuracy calculation, which is not supported in this version of Oracle Capacity Planner.
All subsequent columns contain the values for the data items collected for that class, as they are actually named. In aggregate tables, these columns are prefixed with a two-character abbreviation for the aggregation statistic that the column contains. Table 4-4 shows these abbreviations and their meanings.
| Prefix | Meaning |
|---|---|
|
AV |
Average |
|
SM |
Sum |
|
MN |
Minimum |
|
MX |
Maximum |
|
SD |
Standard deviation |
|
VR |
Variance |
|
CT |
Count |
These statistics are calculated for the set of data in that aggregate from the next lowest level. For example, a row in the DAY aggregate table contains statistics calculated for all entries in the HOUR table for that day.
|
 Copyright © 1996-2001, Oracle Corporation. All Rights Reserved. |
|