Release 9.0.1
Part Number A86647-01
Home |
Book List |
Contents |
Index |
 Master Index |
 Feedback |
| Oracle Enterprise Manager Database Tuning with the Oracle Tuning Pack Release 9.0.1 Part Number A86647-01 |
|
This chapter contains the following topics:
To begin your tuning session, you should have the following:
Oracle SQL Analyze can be started from Tuning Pack drawer on the Oracle Enterprise Manager console, from the menu, or from the System Prompt.
To begin Oracle SQL Analyze from the menu, select Tools=>Tuning Pack=>Oracle SQL Analyze.
To begin from the System prompt, type vmq.
In order to run Oracle SQL Analyze, you should assign the SQLADMIN role to the user that will run Oracle SQL Analyze. Having this role will make the tool more useful but it is not required.
|
Note: The permissions contained within this role are also in the DBA role. Therefore, DBAs do not need the SQLADMIN role assigned to them. |
The VMQROLE.SQL script has been provided to help automate the process of creating the SQLAMDIN role. It is located in the $ORACLE_HOME\SYSMAN\ADMIN directory.
Throughout the tuning process, you will be working in a main window divided into a number of separate panes. The types of panes and their locations within the main window depend upon the type of action you are performing. For example, when you are generating and analyzing explain plans, the window will be divided into the Navigator pane, the SQL Text pane, and the Details pane.
The following sections describe how the Oracle SQL Analyze interface is used for different operations.
Oracle SQL Analyze stores the information for tuning sessions in the Enterprise Manager repository. The following information is saved when you select Save to Repository from the File menu:
The list of discovered nodes in the Navigator window reflects the information provided by Oracle Enterprise Manager.
|
Note: Oracle SQL Analyze may display additional nodes whose connections have been dropped, if there are tuning sessions associated with the disconnected node. |
Object properties and their estimates/statistics are not saved in the repository.
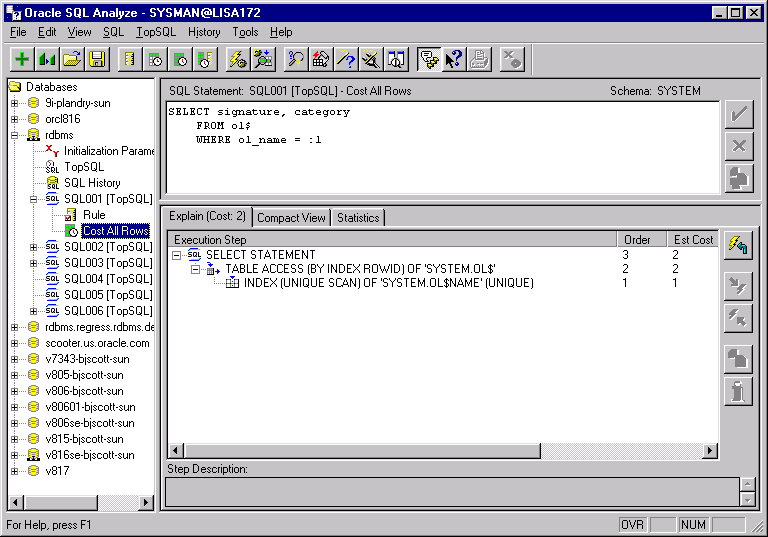
The Main window is the basic work area for SQL statement creation and tuning. It displays the databases, sessions, and SQL statements you are working with, as well as the explain plans for the SQL statements.
As shown in Figure 4-1, the Main window is usually divided into three panes:

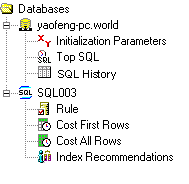
The Navigator pane provides access to the database services against which you can tune your SQL statements. The Navigator pane is always displayed, and is shown in Figure 4-2.

The top level is the database node, just as it is represented in Oracle Enterprise Manager Navigator pane.
Clicking on the "+" symbol for a Database reveals the Initialization Parameters, TopSQL, SQL History, SQL Statement, Explain Plan, and Tuning Recommendation objects related to that database.
Clicking on the TopSQL object activates the TopSQL filtering operation, which allows you to sort SQL statements stored in V$SQLAREA according to the resources they consume. TopSQL items can be double-clicked as well as dragged and dropped.
Selecting the SQL History object calls the SQL History, which allows you to sort SQL statements stored in the SQL History repository.
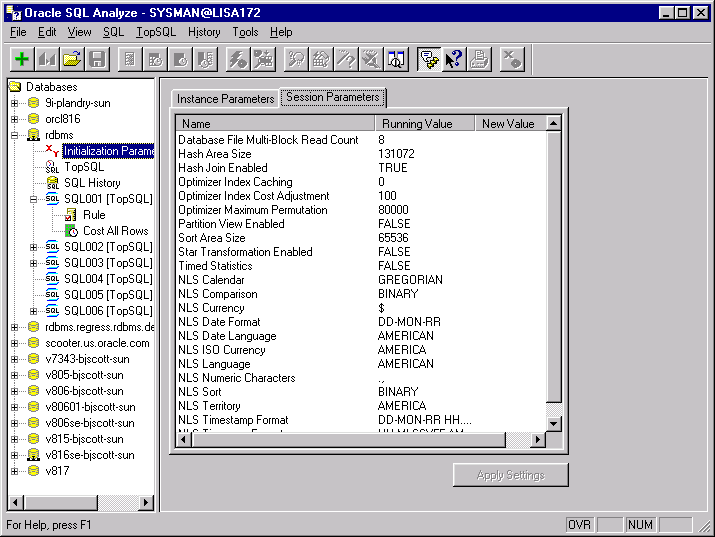
Clicking on the Initialization Parameters object displays instance parameters you can edit to simulate different database environments.
The SQL Statement Object contains a single specific syntactical version of a SQL statement. Clicking on this object displays the statement in the SQL Text window.
The Explain Plan object contains a single explain plan generated for the SQL statement. Oracle SQL Analyze lets you generate Rule-based explain plans for all SQL statements, and Cost-based explain plans for SQL statements that have been analyzed with the ANALYZE command.
The Index Tuning Recommendations object is created if you generate index tuning recommendations for the SQL statement.
The SQL Text pane, as shown in Figure 4-3, displays the SQL statement currently being analyzed.
In this pane, you can edit the statement.

The statement name, type of explain plan that is currently displayed in the Details pane, and the owner of the current schema are listed at the top of the SQL Text pane.
The two buttons to the right of the text pane allow you to confirm or reject edits made to the SQL statement and revert back to the last saved version of the statement.
To confirm and save an edit, select the Apply button (marked by a check mark).
To reject an edit and revert back to the last saved version, select the Revert button ("X").
When you select either Apply or Revert, Oracle SQL Analyze will refresh all child objects of the SQL object, such as the explain plan or index tuning recommendations. If you select Cancel, the child objects will be marked as invalid until they are refreshed.
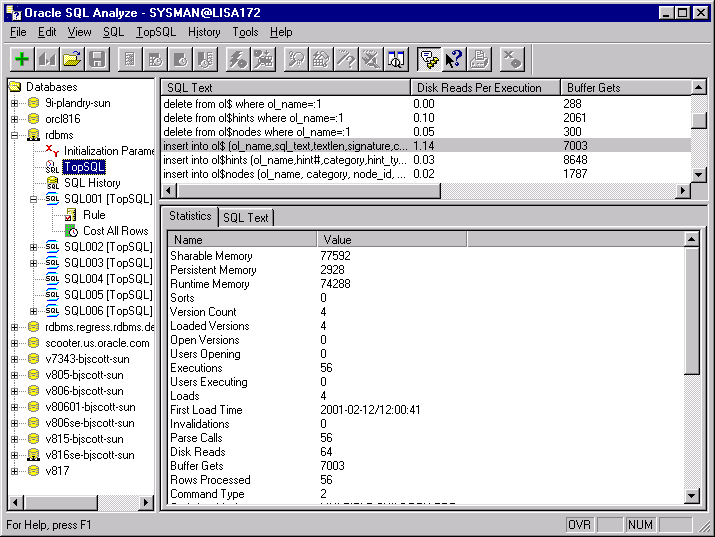
When you are using TopSQL or SQL History, the SQL Text window displays multiple SQL statements, sorted by order of resource consumption, as shown in Figure 4-4. You can drag these statements over to the Navigator window or double-click on these statements to create SQL Statement objects.

The Details pane displays information about the subject of your analysis. Its size appearance differs depending upon the operation being performed.
If, for example, you are creating explain plans based on the statement in the text pane, the Details pane occupies the space to the right of the Navigator pane and below the SQL Text pane as shown in Figure 4-1. If you are examining initialization parameters of a database, the Details pane occupies all the space to the right of the Navigator pane, as shown in Figure 4-5.

Although there are several ways to begin a SQL tuning session, the most likely scenario is that you want to identify existing SQL statements that are creating bottlenecks in your system. Statements that have the most potential to improve performance, if tuned, are those that:
You can use the TopSQL function to sort the statements located in the V$SQLAREA view (those statements that have been run or are ready to be run against the database) according to their resource consumption. TopSQL is described in the next section, "Selecting Statements with TopSQL."
You can also examine statements stored in the SQL History repository. You can select statements from the SQL History the same way you select statements fromTopSQL. For more information about the SQL History, see "Using SQL History".
Other ways to select a statement for tuning include:
TopSQL lets you examine SQL statements that have been used on the database and the resources they consume. Using the statistics in this list, you can determine which statements consume the most resources and then select them for tuning.
TopSQL takes its statistics from the V$SQLAREA view. The V$SQLAREA view lists statistics on shared SQL areas, and provides statistics on SQL statements that are in memory, parsed, and ready for execution or which might have been executed already.
To start a TopSQL analysis:
The statements are displayed in the TopSQL View in order of their resource consumption.

TopSQL lets you sort the statements based on their use of the following database resources which are most likely to impact performance:
The rate at which Oracle finds the data blocks it needs already in memory. The closer the hit ratio is to 100%, the better your system will perform.
The number of buffer gets for all cursors. A measurement of CPU usage, excessive buffer gets may indicate that this statement needs to be examined more closely.
The number of executions carried out for the statement.
This statistic shows the average number of buffer gets per execution. Excessive CPU usage may indicate that this statement needs to be examined more closely.
The number of buffer gets per row processed.
The number of disk reads for all cursors.
This statistic takes the number of times the statement has been executed and calculates the number of disk reads per execution. Excessive disk reads may indicate that this statement needs to be examined more closely.
The number of times the statement was executed since it was brought into the library cache.
The number of times a parsed representation of a SQL statement has been called-- or reused--for all cursors.
The number of times the SQL statement was parsed per execution. Ideally, a SQL statement should be parsed once and executed multiple times, but some front-end applications re-parse every time they execute. The ratio can range from 0 to 1. A ratio close to 0 is good. A ratio close to or equal to 1 indicates unnecessary parse calls.
The total number of rows the parsed SQL statement returns. Depending upon the purpose of the statement, you may find the rows processed higher or lower than expected, indicating a need to examine this statement further.
The number of sorts that was done for all cursors. An excessive number of sorts may indicate inefficient use of indexes or syntax that needs to be optimized.
Along with those listed above, the following statistics are displayed in the lower pane:
You can read its complete list of V$SQLAREA statistics to gain a full understanding of the performance of a statement, then decide which statements require tuning, and what performance problems need to be addressed. These statistics are discussed more completely in the Oracle9i Database Performance Guide and Reference.
To enter a new SQL statement, select SQL=>Create New SQL. Then enter the new statement in the SQL Statement pane located in the upper right portion of the Main Window.
To import or copy an existing SQL statement into Oracle SQL Analyze:
From a SQL script
Select File => Open SQL to open a SQL script. A dialog will open, letting you select the desired SQL script.
From TopSQL or SQL History
Drag the desired SQL statement from the SQL Text pane onto a session or SQL object.
To open a previously used tuning session, click on the desired SQL statement object or explain plan object.
Oracle SQL Analyze prints SQL statements, explain plans, and statistical data for the statements and plans.
To print a SQL statement and its performance statistics, select the SQL object in the Navigator window, then select File=>Print.
To print a SQL statement, its explain plan, and the performance statistics for that explain plan, select the explain plan object in the Navigator window, then select File =>Print.
To print the list of TopSQL statements displayed in the SQL text pane, select TopSQL=>Print.
To print the list of SQL History statements displayed in the SQL Text pane, select History=>Print.
To save a SQL statement into a file, select File => Save SQL As.
To save the current tuning session, select File => Save to Repository.
|
 Copyright © 1996-2001, Oracle Corporation. All Rights Reserved. |
|