| Oracle9i Data Mining Concepts Release 9.2.0.2 Part Number A95961-02 |
|


|
View PDF |
| Oracle9i Data Mining Concepts Release 9.2.0.2 Part Number A95961-02 |
|
|
View PDF |
Oracle9i Data Mining (ODM) embeds data mining within the Oracle9i database. The data never leaves the database -- the data, data preparation, model building, and model scoring activities all remain in the database. This enables Oracle9i to provide an infrastructure for data analysts and application developers to integrate data mining seamlessly with database applications.
Data mining functions such as model building, testing, and scoring are provided via a Java API. This chapter provides an overview of basic Oracle9i Data Mining concepts. It is organized as follows:
With Release 2, Oracle9i Data Mining adds several data mining capabilities: Adaptive Bayes Network, clustering, attribute importance (also known as feature selection), and others, as described below.
A significant benefit of ABN is that they produce a set of human-readable "rules" or explanations that can be interpreted by analysts and managers. Users can then query the database for all records that fit the criteria of a rule.
Oracle9i Data Mining has two main components:
The Oracle9i Data Mining API is the component of Oracle9i Data Mining that allows users to write Java programs that mine data.
The ODM API provides an early look at concepts and approaches being proposed for the emerging standard Java Data Mining (JDM). JDM follows Sun Microsystem's Java Community Process as a Java Specification Request (JSR-73). JDM used design elements from several evolving data mining standards, including the Object Management Group's Common Warehouse Metadata (CWM), the Data Mining Group's Predictive Model Markup Language (PMML), and the International Standards Organization's SQL/MM for Data Mining. JDM has also influenced these standards. Oracle9i Data Mining will comply with the JDM standard when that standard is published.
The Data Mining Server (DMS) is the server-side, in-database component that performs the data mining operations within the 9i database, and thus benefits from RDBMS availability and scalability.
The DMS also provides a metadata repository consisting of mining input objects and result objects, along with the namespaces within which these objects are stored and retrieved.
Data mining models are based on one of two kinds of learning: supervised and unsupervised (sometimes referred to as directed and undirected learning). Supervised learning functions are typically used to predict a value.Unsupervised learning functions are typically used to find the intrinsic structure, relations, or affinities in a body of data but no classes or labels are assigned a priori. Examples of unsupervised learning algorithms include k-means clustering and Apriori association rules. An example of supervised learning algorithms includes Naive Bayes for classification.
ODM supports the following data mining functions:
In a classification problem, you have a number of cases (examples) and wish to predict which of several classes each case belongs to. Each case consists of multiple attributes, each of which takes on one of several possible values. The attributes consist of multiple predictor attributes (independent variables) and one target attribute (dependent variable). Each of the target attribute's possible values is a class to be predicted on the basis of that case's predictor attribute values.
Classification is used in customer segmentation, business modeling, credit analysis, and many other applications. For example, a credit card company may wish to predict which customers will default on their payments. Each customer corresponds to a case; data for each case might consist of a number of attributes that describe the customer's spending habits, income, demographic attributes, etc. These are the predictor attributes. The target attribute indicates whether or not the customer has defaulted; that is, there are two possible classes, corresponding to having defaulted or not. The build data are used to build a model that you then use to predict, for new cases, whether those customers are likely to default.
A classification task begins with build data for which the target values (or class assignments) are known. Different classification algorithms use different techniques for finding relations between the predictor attributes' values and the target attribute's values in the build data. These relations are summarized in a model, which can then be applied to new cases with unknown target values to predict target values. A classification model can also be used on build data with known target values, to compare the predictions to the known answers. This technique is used when testing a model to measure the model's predictive accuracy. The application of a classification model to new data is often called scoring the data.
In a classification problem, it may be important to specify the costs involved in making an incorrect decision. Doing so can be useful when the costs of different misclassifications varies significantly.
For example, suppose the problem is to predict whether a user will respond to a promotional mailing. The target has two categories: YES (the customer responds) and NO (the customer does not respond). Suppose a positive response to the promotion generates $500 and that it costs $5 to do the mailing. If the model predicts YES and the actual value is YES, the cost of misclassification is $0. If the model predicts YES and the actual value is NO, the cost of misclassification is $5. If the model predicts NO and the actual value is YES, the cost of misclassification is $500. If the model predicts NO and the actual value is NO, the cost is $0.
The row indexes of a cost matrix correspond to actual values; the column indexes correspond to predicted values. For any pair of actual/predicted indexes, the value indicates the number of records classified in that pairing.
Some algorithms, like Adaptive Bayes Network, optimize for the cost matrix directly, modifying the model structure so as to produce minimal cost solutions. Other algorithms, like Naive Bayes, that predict probabilities, use the cost matrix during scoring to propose the least expensive solution.
In building a classification model, you may need to balance the number of positive and negative cases for the target of a supervised model. This can happen either because a given target value is rare in the population, for example, fraud cases, or because the data you have does not accurately reflect the real population, that is, the data sample is skewed.
A classification model works best when it has a reasonable number of examples of each target value in its build data table. When only a few possible values exist, it works best with more or less equal numbers of each value.
For example, a data table may accurately reflect reality, yet have 99% negatives in its target classification and only 1% positives. A model could be 99% accurate if it predicted on the negative case, yet the model would be useless.
To work around this problem, you can create a build data table in which positive and negative target values are more or less evenly balanced, and then supply priors information to tell the model what the true balance of target values is.
Clustering is a technique useful for exploring data. It is particularly useful where there are many cases and no obvious natural groupings. Here, clustering data mining algorithms can be used to find whatever natural groupings may exist.
Clustering analysis identifies clusters embedded in the data. A cluster is a collection of data objects that are similar in some sense to one another. A good clustering method produces high-quality clusters to ensure that the inter-cluster similarity is low and the intra-cluster similarity is high; in other words, members of a cluster are more like each other than they are like members of a different cluster.
Clustering can also serve as a useful data-preprocessing step to identify homogeneous groups on which to build predictive models. Clustering models are different from predictive models in that the outcome of the process is not guided by a known result, that is, there is no target attribute. Predictive models predict values for a target attribute, and an error rate between the target and predicted values can be calculated to guide model building. Clustering models, on the other hand, uncover natural groupings (clusters) in the data. The model can then be used to assign groupings labels (cluster IDs) to data points.
In ODM a cluster is characterized by its centroid, attribute histograms, and place in the clustering model hierarchical tree. ODM performs hierarchical clustering using an enhanced version of the k-means algorithm and O-Cluster, an Oracle proprietary algorithm. The clusters discovered by these algorithms are then used to create rules that capture the main characteristics of the data assigned to each cluster. The rules represent the hyperboxes (bounding boxes) that envelop the clusters discovered by the clustering algorithm. The antecedent of each rule describes the clustering bounding box. The consequent encodes the cluster ID for the cluster described by the rule. For example, for a dataset with two attributes: AGE and HEIGHT, the following rule represents most of the data assigned to cluster 10:
The clusters are also used to generate a Bayesian probability model which is used during scoring for assigning data points to clusters.
The Association Rules model is often associated with "market basket analysis", which is used to discover relationships or correlations among a set of items. It is widely used in data analysis for direct marketing, catalog design, and other business decision-making processes. A typical association rule of this kind asserts the likelihood that, for example,"70% of the people who buy spaghetti, wine, and sauce also buy garlic bread."
Association rules capture the co-occurrence of items or events in large volumes of customer transaction data. Because of progress in bar-code technology, it is now possible for retail organizations to collect and store massive amounts of sales data, referred to as "basket data." Association rules were initially defined on basket data, even though they are applicable in several other applications. Finding all such rules is valuable for cross-marketing and mail-order promotions, but there are other applications as well: catalog design, add-on sales, store layout, customer segmentation, web page personalization, and target marketing.
Traditionally, association rules are used to discover business trends by analyzing customer transactions. However, they can also be used effectively to predict Web page accesses for personalization. For example, assume that after mining the Web access log we discovered an association rule "A and B implies C," with 80% confidence, where A, B, and C are Web page accesses. If a user has visited pages A and B, there is an 80% chance that he/she will visit page C in the same session. Page C may or may not have a direct link from A or B. This information can be used to create a link dynamically to page C from pages A or B so that the user can "click-through" to page C directly. This kind of information is particularly valuable for a Web server supporting an e-commerce site to link the different product pages dynamically, based on the customer interaction.
Association rule mining can be formally defined as follows: Let I = {i1, i2, ..., in} be a set of literals (constants: either a number or a character) called items and D be a set of transactions where each transaction T is a set of items such that T is a subset of I. Associated with each transaction is an identifier, called its TID. An association rule is an implication of the form X implies Y, where X and Y are both subsets of I, and X intersect Y is empty. The rule has support s in the database D if s% of the transactions in D contain both X and Y, and confidence c if c% of transactions that contain X also contain Y. The problem of mining association rules is to generate all rules that have support and confidence greater than the user-specified minimum support and minimum confidence, respectively.
Algorithms that calculate association rules work in two phases. In the first phase, all combinations of items that have the required minimum support (called the "frequent item sets") are discovered. In the second phase, rules of the form X implies Y with the specified minimum confidence are generated from the frequent item sets. Typically the first phase is computationally expensive and has in recent years attracted attention from researchers all over the world. This has resulted in several innovative techniques for discovering frequent item sets.
There are several properties of association rules that can be calculated. ODM supports two:
These statistical measures can be used to rank the rules and hence the predictions.
Attribute Importance, also known as feature selection, provides an automated solution for improving the speed and possibly the accuracy of classification models built on data tables with a large number of attributes.
Attribute Importance ranks the predictive attributes by eliminating redundant, irrelevant, or uninformative attributes and identifying those predictor attributes that may have the most influence in making predictions. ODM examines data and constructs classification models that can be used to make predictions about subsequent data. The time required to build these models increases with the number of predictors. Attribute Importance helps a user identify a proper subset of these attributes that are most relevant to predicting the target. Model building can proceed using the selected attributes (predictor attributes) only.
Using fewer attributes decreases model building time, although sometimes at a cost in predictive accuracy. Using too many attributes (especially those that are "noise") can affect the model and degrade its performance and accuracy. By extracting as much information as possible from a given data table using the smallest number of attributes, a user can save significant computing time and often build better models.
Attribute Importance permits the user to specify a number or percentage of attributes to use; alternatively the user can specify a cutoff point. After an Attribute Importance model is built, the user can select the subset of attributes based on the ranking or the predictive value.
Attribute Importance can be applied to data tables with a very large set of attributes. However, the DBA may have to tune the database in various ways to ensure that a large Attribute Importance build executes efficiently. For example, it is important to ensure that there is adequate swap space and table space.
Oracle9i Data Mining supports the following data mining algorithms:
The choice of data mining algorithm depends on the data and the conclusions to be reached.
For classification:
For clustering:
Adaptive Bayes Network (ABN) is an Oracle proprietary algorithm supporting decision-tree-like features in that it produces "rules". ABN provides a fast, scalable, non-parametric means of extracting predictive information from data with respect to a target attribute. (Non-parametric statistical techniques avoid assuming that the population is characterized by a family of simple distributional models, such as standard linear regression, where different members of the family are differentiated by a small set of parameters.)
ABN can provide such information in the form of human-understandable rules. For example, a rule may be "If income is $70K-$80K and household size is 3-5, the likelihood of owning a late-model minivan is YES." The rules produced by ABN are one of its main advantages over Naive Bayes. The business user, marketing professional, or business analyst can understand the basis of the model's predictions and can therefore be comfortable acting on them and explaining them to others.
In addition to explanatory rules, ABN provides performance and scalability, which are derived via a collection of user parameters controlling the trade-off of accuracy and build time.
ABN predicts binary as well as multiclass targets. Binary targets are those that take on only two values, for example, buy and not buy. Multiclass targets have more than two values, for example, products purchased (product A or product B or product C). Multiclass target values are not assumed to exist in an ordered relation to each other, for example, hair brush is not assumed to be greater or less than comb.
ABN can use costs and priors for both building and scoring (see Section 1.3.1.1, "Costs" and Section 1.3.1.2, "Priors").
A key concept for ABN is network feature. Network features are like individual decision trees. Features are tree-like multi-attribute structures. From the standpoint of the network, features are conditionally independent components. Features contain at least one attribute (the root attribute). Conditional probabilities are computed for each value of the root predictor. A two-attribute feature will have, in addition to the root predictor conditional probabilities, computed conditional probabilities for each combination of values of the root and the depth 2 predictor. That is, if a root predictor, x, has i values and the depth 2 predictor, y, has j values, a conditional probability is computed for each combination of values {x=a, y=b such that a is in the set [1,..,i] and b is in the set [1,..,j]}. Similarly, a depth 3 predictor, z, would have an additional associated conditional probability computed for each combination of values {x=a, y=b, z=c such that a is in the set [1,..,i] and b is in the set [1,..,j] and c is in the set [1,..,k]}.
To control the execution time of a build, ABN provides four user-settable parameters:
The algorithm outputs its current model state and statistics that provide an estimate of how long it would take for the model to build (and prune) a feature.
See Table 1-1, below, for a comparison of the main characteristics of the two classification algorithms, Adaptive Bayes Network and Naive Bayes.
The Naive Bayes algorithm (NB) makes predictions using Bayes' Theorem, which derives the probability of a prediction from the underlying evidence, as described below. NB affords fast model building and scoring.
NB can be used for both binary and multiclass classification problems to answer questions such as "Which customers will switch to a competitor? Which transaction patterns suggest fraud? Which prospects will respond to an advertising campaign?" For example, suppose a bank wants to promote its mortgage offering to its current customers and that, to reduce promotion costs, it wants to target the most likely prospects. The bank has historical data for its customers, including income, number of household members, money-market holdings, and information on whether a customer has recently obtained a mortgage through the bank. Using NB, the bank can predict how likely a customer is to respond positively to a mortgage offering. With this information, the bank can reduce its promotion costs by restricting the promotion to the most likely candidates.
Bayes' Theorem proves the following equation:
P(this-prediction | this-evidence) = P(this-prediction) P(this-evidence | this-prediction)
sumP(some-prediction) P(this-evidence | some-prediction)
where P means "probability of", " | " means "given", and "sum" means "sum of all these terms". Translated into English, the equation says that the probability of a particular predicted event, given the evidence in this instance, is computed from three other numbers: the probability of that prediction in similar situations in general, ignoring the specific evidence (this is called the prior probability); times the probability of seeing the evidence we have here, given that the particular prediction is correct; divided by the sum, for each possible prediction (including the present one), of a similar product for that prediction (i.e., the probability of that prediction in general, times the probability of seeing the current evidence given that possible prediction).
NB assumes that each attribute, or piece of evidence, is independent from the others. In practice, this assumption usually does not degrade the model's predictive accuracy significantly, and makes the difference between a computationally feasible algorithm and an intractable one.
It is useful to have a good estimate of the accuracy of any predictive model. An especially accurate estimate of accuracy is a type of cross-validation called "leave-one-out cross-validation", discussed below.
Naive Bayes cross-validation permits the user to test model accuracy on the same data that was used to build the model, rather than building the model on one portion of the data and testing it on a different portion. Not having to hold aside a portion of the data for testing is especially useful if the amount of build data is relatively small.
"Leave-one-out cross-validation" is a special case of cross-validation in which one record is left out of the build data when building each of several models. The number of models built equals the number of records (omitting a different build record for each model), which makes this procedure computationally expensive. With Naive Bayes models, however, the approach can be modified such that all build records are used for building a single model. Then, the model is repeatedly modified to quickly remove the effects of one build record, incrementally "unbuilding" the model for that record, as though that record had been omitted when building the model in the first place. The accuracy of the prediction for each build record can then be assessed against the model that would have been built from all the build records except that one, without having had to actually build a separate model for each build record.
To use Naive Bayes cross-validation, the user executes a MiningTaskCrossValidate task, specifying that a Naive Bayes model is to be built and tested. The execution of the cross-validate task creates a MiningTestResult object populated with the test results.
See Table 1-1, below, for a comparison of the main characteristics of ABN and NB.
Model Seeker is a new feature of the ODM API that allows a user to build multiple classifications, evaluate the models, and select a "best" model, asynchronously.
The models to be built and evaluated can be a combination of Naive Bayes (NB) and Adaptive Bayes Network (ABN) models. Model Seeker does not build unsupervised models.
After building the specified models, Model Seeker evaluates each model by testing and calculating lift. Model Seeker generates a summary of information about each model built so that a user can manually select the "best" model using different criteria, if desired.
Model Seeker's criterion for the "best" model is the one with the largest value for the weighted target positive and total negative relative error rate. The weight is set as the relative importance of the positive category to the other categories treated as a single negative category. If the weight is set to 1.0, the positive category error rate has the same weight as all the other categories combined.
The following formula is used to calculate the figure of merit (FOM) for the "best" model, where FOM is the weighted sum of target positive relative accuracy and total negative relative accuracy:
FOM = W * (number of correct positives) + (number of correct negatives)
( W + 1 ) * (number of actual positives) ( W + 1 ) * (number of actual negatives)
where W is the user-specified weight, a value that must be > 0. The weight is the ratio of the false negative cost to the false positive cost. A weight of 1 means that the false positives and false negatives have equal weight.
The k-means algorithm is a distance-based clustering algorithm that partitions the data into a predetermined number of clusters (provided there are enough distinct cases). The k-means algorithm works only with numerical attributes. Distance-based algorithms rely on a distance metric (function) to measure the similarity between data points. Data points are assigned to the nearest cluster according to the distance metric used.
ODM implements a hierarchical version of the k-means algorithm. The tree can either be grown one level at a time (balanced approach) or one node at the time (unbalanced approach). The node with the largest distortion (sum of distance to the node's centroid) is split to increase the size of the tree until the desired number of clusters is reached.
This incremental approach to k-means avoids the need for building multiple k-means models and provides clustering results that are consistently superior to the traditional k-means.
The choice between balanced and unbalanced approaches is controlled by the system parameter CL_ALG_SETTING_TREE_GROWTH in the
ODM_CONFIGURATION table. The balanced approach is faster than the unbalanced approach, while the unbalanced approach generates models with smaller overall distortion.
ODM-enhanced k-means bins the data internally, thus providing automatic data discretization. However, if manual binning is used, the bin values should be represented by contiguous integer numbers starting at 1. In addition, the same number of bins should be used for all attributes.
k-means works with numerical data only. As a result, if a user would like to cluster data with categorical attributes, he/she should "explode" the categorical attribute into multiple binary columns (one per unique value of the categorical attribute) before using ODM clustering k-means.
Because traditional k-means requires multiple passes through the data, it can be impractical for large data tables that don't fit in memory. In this case multiple expensive database scans would be required. ODM's enhanced k-means requires at most one database scan. For data tables that don't fit in memory, the enhanced k-means algorithm employs a smart summarization approach that creates a summary of the data table that can be stored in memory. This approach allows the enhanced k-means algorithm to handle data tables of any size. The summarization scheme can be seen as a smart sampling approach that first identifies the main partitions in the data and then generates summary points for each partition in proportion to their share of the total data. Each summary point has a weight that accounts for the proportion of the data it represents.
The clusters discovered by enhanced k-means are used to generate a Bayesian probability model that is then used during scoring (model apply) for assigning data points to clusters. The traditional k-means algorithm can be interpreted as a mixture model where the mixture components are spherical multivariate normal distributions with the same variance for all components. (A mixture model is a type of density model that includes several component functions (usually Gaussian) that are combined to provide a multimodal density.)
In the mixture model created from the clusters discovered by enhanced k-means, on the other hand, the mixture components are a product of independent normal distribution with potentially different variances. Because of this greater flexibility, the probability model created by enhanced k-means provides a better description of the underlying data than the underlying model of traditional k-means.
See Table 1-2, below, for a comparison of the main characteristics of the two clustering algorithms.
The O-Cluster algorithm creates a hierarchical grid-based clustering model, that is, it creates axis-parallel partitions in the input attribute space. The algorithm operates recursively. The resulting hierarchical structure represents an irregular grid that tessellates the attribute space into clusters. The resulting clusters define dense areas in the attribute space. The clusters are described by intervals along the attribute axes and the corresponding centroids and histograms. A parameter called sensitivity defines a baseline density level. Only areas with peak density above this baseline level can be identified as clusters.
O-Cluster bins the data internally, thus providing automatic data discretization. However, if manual binning is used, the bin values should be represented by contiguous integer numbers starting at 1.
Binary attributes should be declared as categorical. O-Cluster distinguishes between continuous and discrete numerical attributes. The two types of attributes undergo different binning procedures in order to capture the characteristics of the underlying distributions. For example, a discrete numerical attribute such as age should be declared of data type INTEGER. On the other hand, continuous numerical attributes such as height measured in feet should be declared of data type NUMBER.
The clusters discovered by O-Cluster are used to generate a Bayesian probability model that is then used during scoring (model apply) for assigning data points to clusters. The generated probability model is a mixture model where the mixture components are represented by a product of independent normal distributions for numerical attributes and multinomial distributions for categorical attributes.
The main characteristics of the enhanced k-means and O-Cluster algorithms are summarized in Table 1-2, below.
ODM Attribute Importance is implemented using the Predictor Variance algorithm. Predictor Variance estimates the variances of the predictor target combinations and the variance with respect to the other predictors.
The basic concept is that the higher the sum of the variances, the more informative the predictor attribute is in the build data table. These statistics give an idea of how correlated each predictor is with the target attribute. Predictor variance assesses the relative usefulness of each attribute for making predictions for rows in general, instead of making a prediction for any particular case.
For algorithms like ABN that perform automatic attribute selection, the attributes selected may differ significantly from Predictor Variance. This is because of the different techniques used to derive the important attributes.
The association rule mining problem can be decomposed into two subproblems:
The Apriori algorithm for finding frequent itemsets makes multiple passes over the data. In the kth pass, it finds all itemsets having k items, called the k-itemsets. Each pass consists of two phases. Let Fk represent the set of frequent k-itemsets, and Ck the set of candidate k-itemsets (potentially frequent itemsets). First, is the candidate generation phase where the set of all frequent (k-1) itemsets, Fk-1, found in the (k-1)th pass, is used to generate the candidate itemsets Ck. The candidate generation procedure ensures that Ck is a superset of the set of all frequent k-itemsets. A specialized in-memory hash-tree data structure is used to store Ck. Then, data is scanned in the support counting phase. For each transaction, the candidates in Ck contained in the transaction are determined using the hash-tree data structure and their support count is incremented. At the end of the pass, Ck is examined to determine which of the candidates are frequent, yielding Fk. The algorithm terminates when Fk or Ck+1 becomes empty.
In ODM, we use an SQL-based implementation of the Apriori algorithm. The candidate generation and support counting steps are implemented using SQL queries. We do not use any specialized in-memory data structures. The SQL queries are fine-tuned to run efficiently in the database server by using various hints.
Data mining tasks in ODM include model building, testing, computing lift, and applying (scoring), as well as importing and exporting a PMML representation of certain models.
All models go through a build process. Classification models also have a testing phase in which a different data table also containing known target values is presented to the model and the predicted value is compared with the known (or actual) target values. Association Rules, Attribute Importance, and clustering models do not have a testing phase, nor do they compute lift. Classification models and clustering models can both be used to score a data table, whereas an association rules model does not support scoring. ODM imports and exports PMML models for Naive Bayes classification and Association Rules. Attribute Importance supports only build since it produces an importance ordering of the attributes.
Table 1-3 compares data mining tasks performed for the different ODM functions.
Table 1-3 Data Mining Tasks per Function| Function | Build | Test | Compute Lift | Apply (Score) | Import PMML | Export PMML |
|---|---|---|---|---|---|---|
|
Classification |
X |
X |
X |
X |
Naive Bayes |
Naive Bayes |
|
Clustering |
X |
|
|
X |
|
|
|
Association Rules |
X |
|
|
|
X |
X |
|
Attribute Importance |
X |
|
|
|
|
|
ODM supports two levels of settings: function and algorithm. When the function level settings do not specify particular algorithm settings, ODM chooses an appropriate algorithm and provides defaults for the relevant parameters. In general, model building at the function level eliminates many of the technical details of data mining.
Models are built in the data mining server (DMS). After a model is built, it is persisted in the DMS and can be accessed by its user-specified unique name.
The typical steps for model building are as follows:
See Section 2.2, "Using ODM to Perform Mining Tasks" in Chapter 2.
Figure 1-1 illustrates the build process. Raw data undergoes the transformations specified by the user and may also be manually binned (i.e., sorted into bins) according to user-specified bin boundaries. The resulting data table, that is, the build data table, is fed to the appropriate ODM algorithm, along with mining function settings. The algorithm performs further data preprocessing that may include automatic internal binning, and then performs the build. The resulting model includes bin boundary tables internal to the algorithm, i.e., the ones that resulted from automatic binning. They are not part of the model if you did not choose automatic binning.
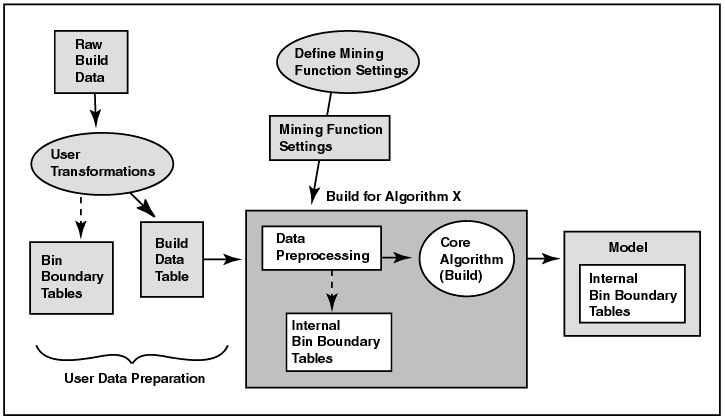
Text description of the illustration build2.gif
Classification models can be tested to get an estimate of their accuracy.
After a model is built, model testing estimates the accuracy of a model's predictions by applying it to a new data table that has the same format as the build data table (see Section 1.6.4, "Logical Data Specification"). The test results are stored in a mining test result object. A classification test result includes a confusion matrix (see Section 1.6.9, "Confusion Matrix") that allows a user to understand the type and number of classification errors made by the model.
ODM supports computing lift for a classification model. Lift can be computed for binary (2 values) target fields and multiclass (more than 2 values) target fields. Given a designated positive target value, that is, the value of most interest for prediction, such as "buyer," or "has disease," test cases are sorted according to how confidently they are predicted to be positive cases. Positive cases with highest confidence come first, followed by positive cases with lowest confidence. Negative cases with lowest confidence come next, followed by negative cases with highest confidence. Based on that ordering, they are partitioned into quantiles, and the following statistics are calculated:
Targets_cumulative can be computed from the quantities that are available in the odm_lift_result_entry using the following formula:
Applying a classification model such as Naive Bayes or Adaptive Bayes Network to data produces scores or predictions with an associated probability. Applying a clustering model to data produces, for each case, a predicted cluster identifier and the probability that the case is in that cluster. The apply data must be in the same format and state of preprocessing as the data used to build the model.
Applying a clustering model to new data produces, for each case, a predicted cluster identifier and the probability that the case belongs to that cluster. The apply data must be in the same format and state of preprocessing as the data used to build the model.
Figure 1-2 shows the apply process. Note that the input data for the apply process must undergo the same preprocessing undergone by the build data table. The data to be scored must have attributes compatible with those of the build data, that is, it must have the same attributes with the same names and respective data types or there must be a suitable mapping of one to the other. The apply data table can have attributes not found in the build data table. The result of the apply operation is placed in the schema specified by the user.
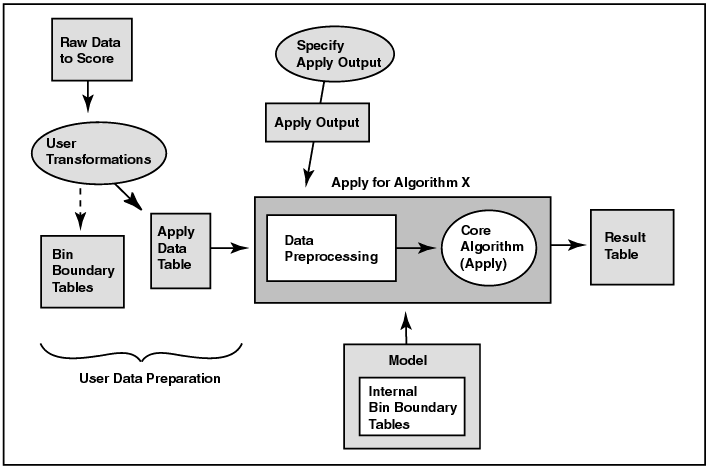
Text description of the illustration apply2.gif
The ODM user specifies the result content. For example, a user may want the customer identifier attribute, along with the score and probability, to be output into a table for each record in the provided mining data. This is specified using the MiningApplyOutput class.
ODM supports the apply operation for a table (a set of cases) or a single case (represented by a Java object). ODM supports multicategory apply, obtaining multiple class values with their associated probabilities for each case.
The principal objects that constitute Oracle9i Data Mining are described below.
A physical data specification object specifies the characteristics of the physical data to be used for mining, for example, whether the data is in transactional or nontransactional format and the roles the various data columns play. The data referenced by a physical data specification object can be used in several ways: model building, testing, computing lift, scoring, transformations, etc.
ODM physical data must be in one of two formats:
These formats describe how to interpret each case as stored in a given database table. See Figure 1-3.
In transactional data format, each case is stored as multiple records in a table with columns sequenceID, attribute_name, and value (these are names user-defined names). This format is also referred to as multi-record case.
sequenceID is an integer that associates multiple records in a transactional table. attribute_name is a string containing the name of the attribute. value is an integer representing the value of the attribute. Note that the values in the Value column must be integers; they become integers when they are binned, that is, the bin ID is an integer (see Section 1.8, "Discretization (Binning)").
In nontransactional format, each case is stored as one record (row) in a table. Nontransactional data is not required to provide a key column to uniquely identify each record. However, a key is recommended to associate cases with resulting scores for supervised learning. This format is also referred to as single-record case.
Note that in Oracle 9i, ODM algorithms automatically convert all nontransactional data to transactional data prior to model building. If data is already in transactional format, algorithm performance can be enhanced over data in nontransactional format.
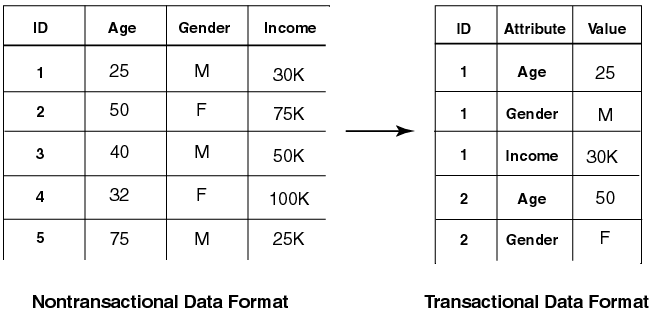
Text description of the illustration transnon.gif
A mining function settings (MFS) object contains the high-level parameters for building a mining model. Oracle9i Data Mining supports several mining algorithms for building a model.
The mining function settings allow a user to specify the type of problem to solve (for example, classification) without having to specify a particular algorithm. The ODM API allows a user to specify an algorithm; however, if none is specified, the data mining system selects an algorithm based on the function settings the user has specified. For example, if the user specifies clustering, the DMS may select k-means as the algorithm to build the model.
Each MFS object consists of the following:
ODM supports the persistence of mining function settings as independent, named entities in the Data Mining Server (DMS).
Table 1-4 displays function-level parameter settings and their default values.
A mining algorithm settings object contains the parameters associated with a particular algorithm for building a model. It allows expert data miners to fine-tune the behavior of the algorithm. Generally, not all parameters must be specified. Missing parameters are replaced with system default values. Algorithm parameters are algorithm-specific, along with their corresponding default values.
ODM's design, which separates mining algorithm settings from mining function settings, enables non-expert data miners to use ODM effectively, while expert data miners can have the control they need.
Table 1-5 displays the algorithm-level parameters and their default values. The default algorithm for a function appears in boldface type.
A logical data specification (LDS) object is a set of mining attribute (see Section 1.6.5, "Mining Attributes") instances that describes the logical nature of the data used as input for model building. This set of mining attributes is the basis for producing the signature of the model. Each mining attribute specified in a logical data specification must have a unique name.
As stored in the DMS, each MFS has its own copy of the LDS, even if references are shared in the API client process.
A mining attribute is a logical concept that describes a domain of data used as input to an ODM data mining operation. Mining attributes are either categorical or numerical. For example, domains of data include "age" ranging from 0 to 100, "buyer" with values true and false. A mining attribute specifies the name, data type, and attribute type (categorical or numeric).
A data usage specification (DUS) object specifies how the attributes in a logical data specification (LDS) instance are used for building a model. A specification contains at most one data usage entry instance for each mining attribute in the LDS. If no data use is specified for an attribute, the default usage is active, implying that the attribute is used in building a model.
Usage includes specifying:
ODM's treatment of attribute names differs from that of Oracle SQL. Oracle SQL can treat attribute names in a case-insensitive manner; ODM attribute names, however, are case-sensitive. The implications of this for ODM users are:
A mining model object is the result of building a model based on a mining function settings object. The representation of the model depends on the algorithm specified by the user or selected by the DMS. Some models can be used for direct inspection, for example, to examine the rules produced from association rules or clusters, others to generate predictions, for example, using a classification model.
ODM supports the persistence of mining models as independent, named entities in the DMS. A mining model contains a copy of the mining function settings (MFS) used to build it. Models cannot be stored by the user.
A mining result object contains the end products of one of the following mining tasks: build, test, compute lift, or apply. ODM supports the persistence of mining results as independent, named entities in the DMS.
A mining result object contains the operation start time and end time, the name of the model used, input data location, and output data location (if any) for the data mining operation.
A build result contains the model details. It provides the function and algorithm name of the model.
An apply result names the destination table (schema and table name) for the result.
Atest result, for classification models, contains the model accuracy and references the confusion matrix.
A lift result of the lift elements is calculated on a per-quantile basis.
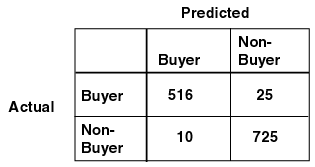
The row indexes of a confusion matrix correspond to actual values observed and used for model testing; the column indexes correspond to predicted values produced by applying the model to the test data. For any pair of actual/predicted indexes, the value indicates the number of records classified in that pairing. For example, a value of 25 for an actual value index of "buyer" and a predicted value index of "nonbuyer" indicates that the model incorrectly classified a "buyer" as a "nonbuyer" 25 times. A value of 516 for an actual/predicted value index of "buyer" indicates that the model correctly classified a "buyer" 516 times.
The predictions were correct 516 + 725 = 1241 times, and incorrect 25 + 10 = 35 times. The sum of the values in the matrix is equal to the number of scored records in the input data table. The number of scored records is the sum of correct and incorrect predictions, which is 1241 + 35 = 1276. The error rate is 35/1276 = 0.0274; the accuracy rate is 1241/1276 = 0.9725.
A confusion matrix provides a quick understanding of model accuracy and the types of errors the model makes when scoring records. It is the result of a test task for classification models.
Text description of the illustration confmtrx.gif
A mining apply output instance contains several items that allow users to tailor the results of a model apply operation. Output can be in one or more of the following forms:
The resulting data representation is in nontransactional form (one record per result).
Through the mining apply object, ODM supports specifying names for the resulting data columns.
There are two types of input to the apply mining operation: a database table for batch scoring and an individual record for record scoring. Apply input data must contain the same attributes that were used to build the model. However, the input data may contain additional attributes, which may appear in the output to describe the output (see source attribute, below).
Batch scoring using an input database table results in a table called the apply output table. An input record is represented as an instance of RecordInstance that contains a set of AttributeInstance objects, each of which describes the name of the attribute, the data type, and the value. The result of record scoring is also an instance of RecordInstance. The output of the apply mining operation is specified by MiningApplyOutput.
An instance of MiningApplyOutput is a specification of the data to be included in the apply output (either a table or a record) created as the result of the apply mining operation. The columns (or attributes) in the apply output are described by a combination of multiple ApplyContentItem objects. Each item can be one of the following:
Typically, users select "top" with n = 1 for obtaining the top likely prediction for each case from, for example, a classification model. However, other users may require seeing the top three predictions, for example, for recommending products to a customer.
The number of columns in the apply output table varies depending on the combination of items. When multiple target values are specified by MiningApplyOutput (if n > 1), n rows of output table correspond to the prediction for an input row.
Consider an input table of 15 rows. If the top 2 predictions (n = 2) with probabilities are specified in MiningApplyOutput with one source attribute from the input table, there will be 3 columns in the output table: the source attribute, the prediction, and its probability.The number of rows in the output table is 30 because the result of apply for each input row will be 2 rows (top 2) in the output table.
If the input data is transactional, the sequence ID is automatically included in the output table. However, explicit inclusion of source attributes is required for nontransactional data.
In this section, we discuss ODM's handing of missing values.
Data tables often contain missing values, that is, one or more of the attributes in a case have a null value. ODM handles missing values as follows, depending on the data format:
Note that this means it is the empty "cell" that is ignored, not the entire record. By "cell", we mean the intersection of one row and one column (attribute name). For transactional data, it can be said that the "row" is ignored because in transactional format, each row contains the value for one attribute.
ODM algorithms require that input data be discretized (binned) before model building, testing, computing lift, and applying (scoring). Binning means grouping related values together to reduce the number of distinct values for an attribute. Having fewer bins typically leads to a more compact model and one that builds faster, but it can also lead to some loss in accuracy. The target attribute is typically not binned.
The decisions about the number of bins, the values that are to be assigned to each bin, where the bin boundaries are to be set, etc., can be made according to program defaults or can be specified by the user.
The best binning is done by an expert familiar with the data being binned and the problem to be solved. However, if there is no additional information that can inform decisions about binning or if what is wanted is an initial exploration of the data and problem, ODM can bin the data using default settings.
The distinction between categorical and numerical attributes depends on the application, that is, the application determines how to treat a particular attribute. The main difference is whether the values of an attribute have a certain order. Values of a categorical attribute do not have any meaningful order; values of a numerical attribute do have a meaningful order. This does not mean that the values of a categorical attribute cannot be ordered, but rather that the order does not matter. For example, since U.S. postal codes are numbers, they can be ordered; however, their order is not necessarily meaningful to an application, and they can therefore be considered categorical.
Because binning can have an effect on a model's accuracy, it is better when an expert specifies the binning based on some information about the data or the problem. However, in cases where there is no additional information to inform binning decisions or when the purpose is to get an initial understanding of the problem, it makes sense to use some form of automatic binning that uses global defaults. For example, group all attributes into five bins, where five is a globally specified default. Then for categorical attributes, the five most frequent values are assigned to five different bins, and all remaining values are assigned to a sixth bin.
For numerical attributes, the values are divided into five groups of equal size according to their order.
An important advantage of automated binning is that it allows ODM to handle raw (unprepared) data, and thus simplifies what can be a daunting task for the user new to data mining. Automated binning also allows initial exploration of problems about which there is little or no information to guide binning decisions.
ODM provides four ways to bin data:
An example of binning is shown below. Table 1-6 displays original data, before binning. Table 1-7 shows the bin boundaries for numeric data; Table 1-8 shows bin boundaries for categorical data. Table 1-9 shows the results of binning.
Table 1-6 Binning Illustration: Data before Binning Table 1-7 Binning Illustration: Bin Boundaries for Numeric Data Table 1-8 Binning Illustration: Bin Boundaries for Categorical Data Table 1-9 Binning Illustration: Assignment of Original Data to Bins| PERSON_ID | AGE | WORK CLASS |
WEIGHT | EDUCATION | MARITAL_STATUS | OCCUPATION |
|---|---|---|---|---|---|---|
|
2 |
2 |
300 |
2 |
1 |
1 |
2 |
|
8 |
4 |
300 |
1 |
3 |
5 |
1 |
|
10 |
3 |
300 |
1 |
1 |
5 |
6 |
|
11 |
1 |
100 |
1 |
2 |
2 |
5 |
|
41 |
2 |
300 |
2 |
2 |
1 |
4 |
Note: Currently automatic binning requires closed intervals for numerical bins. This can result in certain values being ignored. For example, if the salary range in the build data table is 0 to 1,000,000, any salary greater than 1,000,000 is ignored when the model is applied. If you are trying to identify likely purchasers of a high-end consumer product, attributes indicating the wealthiest individuals are likely to be deleted, and you probably won't find the best targets. Manual binning has the option of making extreme bins open-ended, that is, with infinite boundaries.
The Predictive Model Markup Language (PMML) specifies data mining models using an XML DTD (document type definition). PMML provides a standard representation for data mining models to facilitate model interchange among vendors. PMML is specified by the Data Mining Group (http://www.dmg.org).
ODM is both a producer and consumer of PMML models. That is, ODM can produce (generate) a PMML model that can be used by other software that can consume PMML. ODM can also consume PMML models, that is, ODM can convert certain PMML model representations to valid ODM models. ODM is a producer and consumer of two model types: Association Rules models and Naive Bayes classification models.
ODM consumes only models that use features supported by ODM.
|
 Copyright © 2002 Oracle Corporation. All Rights Reserved. |
|

